
 Yahoo Finance
 The Cigna Group's Dividend Analysis
Exploring Dividend Trends and Financial Health of The Cigna Group (NYSE:CI)
Upcoming Dividend Details
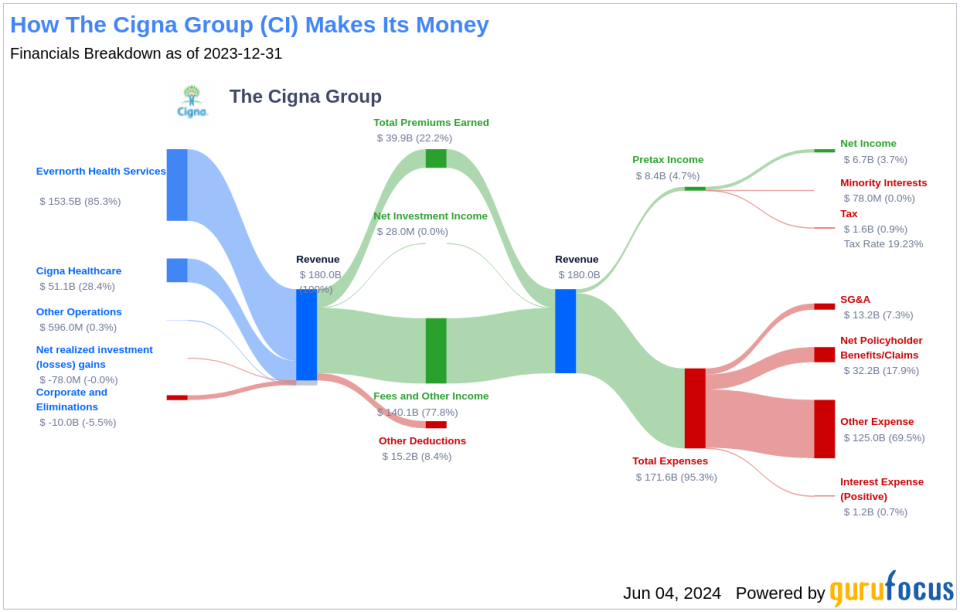
The Cigna Group (NYSE:CI) recently announced a dividend of $1.4 per share, scheduled for payment on June 20, 2024, with the ex-dividend date set for June 4, 2024. As investors anticipate this upcoming disbursement, it's an opportune moment to delve into The Cigna Group's dividend history, yield, and growth rates, drawing on comprehensive data from GuruFocus to evaluate its sustainability.
Company Overview
This Powerful Chart Made Peter Lynch 29% A Year For 13 Years
How to calculate the intrinsic value of a stock?
The Cigna Group primarily operates in pharmacy benefit management (PBM) and health insurance services. Post its 2018 merger with Express Scripts, its PBM and specialty pharmacy services expanded significantly, catering predominantly to health plans and employers. The company boasts the Department of Defense as its largest PBM contract and has recently secured a substantial agreement with Centene. In terms of health insurance and other benefits, The Cigna Group primarily serves employers through self-funding arrangements and currently covers 18 million U.S. medical members as of December 2023.
Dividend History Insight
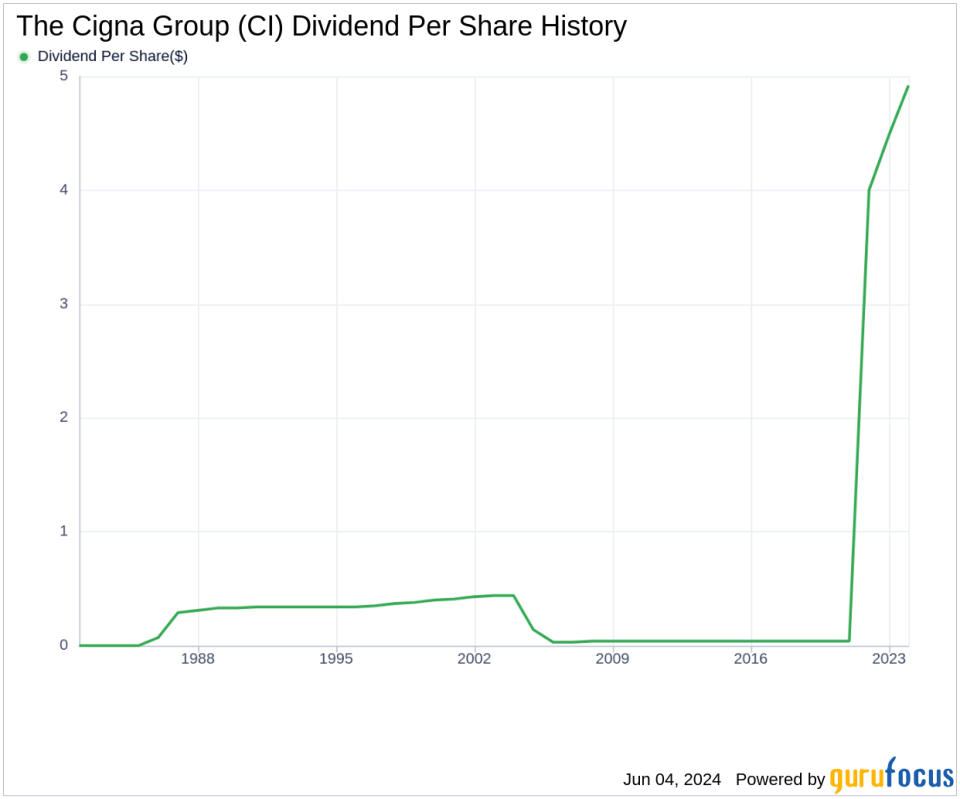
Since 1985, The Cigna Group has maintained a steadfast record of dividend payments, distributed quarterly. Remarkably, the company has increased its dividend annually since 2005, earning it the status of a dividend achiever. This title is reserved for companies that have consistently raised their dividends for at least 19 consecutive years. Below, you can view a chart detailing the annual Dividends Per Share to track historical trends.
Dividend Yield and Growth Analysis
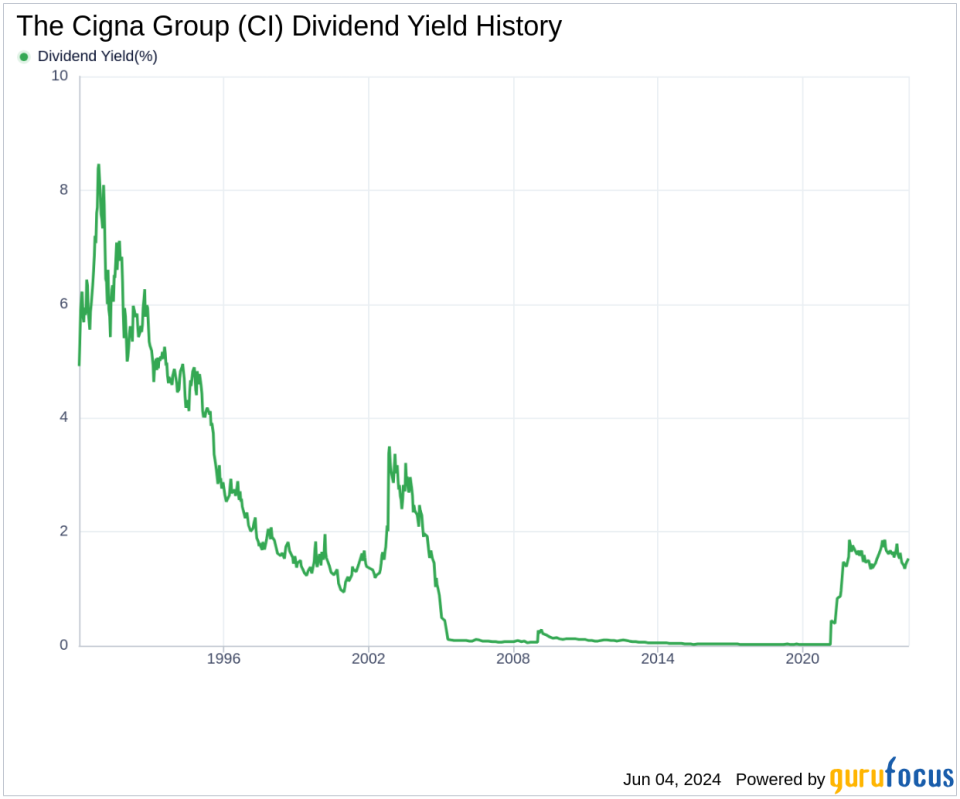
Currently, The Cigna Group boasts a 12-month trailing dividend yield of 1.49% and a forward dividend yield of 1.63%, indicating anticipated increases in dividend payments over the next year. Over the past three years, the annual dividend growth rate was a robust 397.30%, with a five-year rate of 239.90% per annum. Over the last decade, the annual growth rate of dividends per share stands impressively at 67.50%. The 5-year yield on cost for The Cigna Group stock is approximately 675.99% today.
Evaluating Dividend Sustainability
The sustainability of dividends is crucial, and evaluating the dividend payout ratio is key to understanding how much of its earnings The Cigna Group allocates to dividends. With a payout ratio of 0.19 as of March 31, 2024, the company retains a significant portion of earnings for future growth and stability. The Cigna Group's profitability rank is 7 out of 10, reflecting strong earnings potential, supported by a consistent record of positive net income over the past decade.
Future Growth Prospects
For dividends to be sustainable, robust growth metrics are essential. The Cigna Group's growth rank stands at 7 out of 10, indicating a promising growth trajectory. Its revenue per share and 3-year revenue growth rate of approximately 14.70% annually outperform about 65% of global competitors. Additionally, The Cigna Group's 3-year EPS growth rate of 10.80% annually outperforms approximately 52.63% of global competitors, with a 5-year EBITDA growth rate of 11.80%, outperforming about 46.67% of global peers.
Conclusion and Next Steps
The analysis of The Cigna Group's dividend payments, growth rates, payout ratio, and profitability underscores its strong financial health and potential for sustained dividend growth. Investors considering high-dividend yield opportunities may find The Cigna Group an attractive option. For further exploration of high-dividend yield stocks, GuruFocus Premium users can utilize the High Dividend Yield Screener.
This article, generated by GuruFocus, is designed to provide general insights and is not tailored financial advice. Our commentary is rooted in historical data and analyst projections, utilizing an impartial methodology, and is not intended to serve as specific investment guidance. It does not formulate a recommendation to purchase or divest any stock and does not consider individual investment objectives or financial circumstances. Our objective is to deliver long-term, fundamental data-driven analysis. Be aware that our analysis might not incorporate the most recent, price-sensitive company announcements or qualitative information. GuruFocus holds no position in the stocks mentioned herein.
This article first appeared on GuruFocus.
