
 Yahoo Finance
 Comcast (CMCSA) Q1 Earnings Beat Estimates, Revenues Rise Y/Y
Comcast CMCSA reported first-quarter 2024 adjusted earnings of $1.04 per share, which beat the Zacks Consensus Estimate by 6.12% and increased 13% year over year.
Consolidated revenues increased 1.2% year over year to $30.05 billion and beat the Zacks Consensus Estimate by 1.12%.
Domestic broadband average rate per customer increased 4.2% and drove domestic broadband revenue growth of 3.9% to $6.6 billion in the first quarter.
Comcast lost 65K domestic broadband customers in the reported quarter. Moreover, it lost 487K video customers. Domestic wireless customer lines increased 21% compared with the year-ago quarter to 6.9 million, including net additions of 289K in the first quarter.
Shares of CMCSA have lost 8.3% year to date compared with the Zacks Consumer Discretionary sector’s decline of 3.3%.
Comcast Corporation Price, Consensus and EPS Surprise
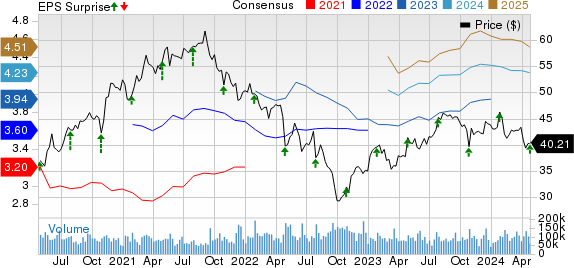
Comcast Corporation price-consensus-eps-surprise-chart | Comcast Corporation Quote
Quarter Details
Connectivity & Platforms revenues (67.5% of revenues) increased 0.6% year over year to $20.27 billion in the reported quarter.
Residential Connectivity & Platforms revenues remained flat year over year at $17.86 billion. Business Services Connectivity revenues increased 5.4% year over year to $2.4 billion.
Content & Experiences revenues (34.5% of revenues) increased 1.1% year over year to $10.37 billion. Media revenues rose 3.6% year over year at $6.37 billion, primarily due to higher domestic distribution revenues.
Studios decreased 7.2% year over year to $2.74 billion due to lower content licensing revenues, primarily reflecting the timing of when content was made available by the company’s film studios. Theatrical revenues increased due to the successful performance of recent releases, including Kung Fu Panda 4 and Migration, compared with theatrical releases in the prior-year period, including Puss in Boots: The Last Wish and M3GAN.
Kung Fu Panda 4 debuted in March and grossed more than $480 million in worldwide box office year to date, contributing to the franchise's cumulative total of $2.3 billion.
Theme Parks gained 1.5% year over year to $1.97 billion due to higher revenues at the company’s domestic theme parks.
Peacock’s paid subscribers rallied nearly 55% year over year to 34 million, including net additions of three million in the first quarter. Peacock’s revenues in the first quarter jumped 54% to $1.1 billion.
Oppenheimer won seven Oscars at the Academy Awards and began streaming exclusively on Peacock starting February and was the most-watched PAY 1 movie in Peacock's history.
Operating Details
Costs and expenses in the first quarter of 2024 increased 0.8% year over year to $24.2 billion.
Programming & production costs decreased 2% from the year-ago quarter to $8.82 billion. Marketing and promotional expenses increased 2.8% year over year to $2.01 billion.
Adjusted EBITDA decreased 0.6% from the year-ago quarter to $9.35 billion.
Total Connectivity & Platforms adjusted EBITDA gained 1.5% year over year to $8.21 billion.
Content & Experiences adjusted EBITDA was $1.49 billion, down 7.1% year over year.
Cash Flow & Liquidity
As of Mar 31, 2024, cash and cash equivalents were $6.58 billion, which increased from $6.21 billion as of Dec 31, 2023.
As of Mar 31, 2024, consolidated total debt was $96.5 billion compared with $97.09 billion as of Dec 31, 2023.
In the first quarter of 2024, Comcast generated $7.84 billion in cash from operations, which increased from $5.92 billion reported in the previous quarter. Free cash flow was $4.53 billion in the reported quarter, which increased from $1.7 billion in the previous quarter.
CMCSA paid dividends totaling $1.2 billion and repurchased 56 million of its shares for $2.4 billion, resulting in a total return of capital to shareholders of $3.6 billion.
Zacks Rank & Stocks to Consider
Currently, Comcast carries a Zacks Rank #3 (Hold).
Disney DIS, Reynolds Consumer Products REYN and Roblox RBLX are some better-ranked stocks that investors can consider in the broader sector. DIS, REYN and RBLX carry a Zacks Rank #2 (Buy) each at present. You can see the complete list of today’s Zacks #1 Rank (Strong Buy) stocks here.
Shares of Disney have rallied 26.2% year to date. DIS is set to report second-quarter fiscal 2024 results on May 7.
Shares of Reynolds Consumer Products have gained 7% year to date. REYN is slated to report first-quarter 2024 results on May 8.
Shares of Roblox have plunged 23.5% year to date. RBLX is set to report first-quarter 2024 results on May 9.
Want the latest recommendations from Zacks Investment Research? Today, you can download 7 Best Stocks for the Next 30 Days. Click to get this free report
Comcast Corporation (CMCSA) : Free Stock Analysis Report
The Walt Disney Company (DIS) : Free Stock Analysis Report
Reynolds Consumer Products Inc. (REYN) : Free Stock Analysis Report
Roblox Corporation (RBLX) : Free Stock Analysis Report
