
 Yahoo Finance
 Commodities Technical Analysis, August 21st – August 25th, 2017
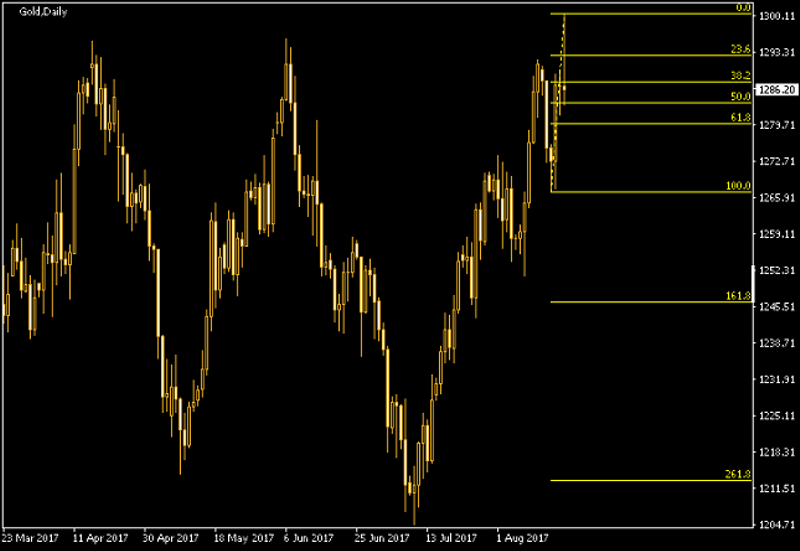
Gold closed the previous week unchanged as investors speculate whether the Fed outlook is hawkish or dovish. Gold prices have been also affected by the geopolitical tension between North Korea sand the US and the terror attack in Spain. Gold trades around the $1291 and is expected to test $1300 as geopolitical tension continue to weigh on markets.
Oil prices closed the previous week in a mixed sentiment as concern of high US production clash with OPEC’s output cut.
The technical analysis, that includes the indicators’ data and major pivot points for WTI Oil, Gold, Silver and Copper as traded on spot market as of August 20th, 2017:
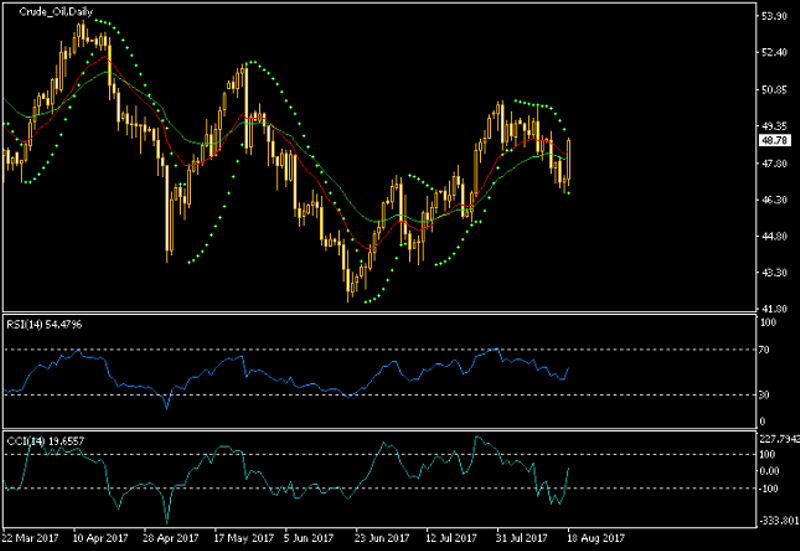
Crude Oil
Indicators
Moving Averages | RSI | Parabolic SAR | CCI |
Long | Neutral | Long | Neutral |
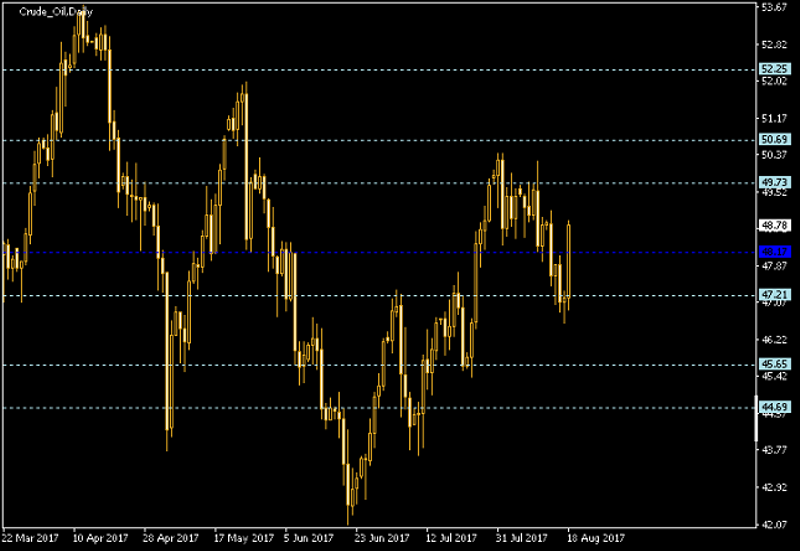
Floor Pivot Points
3rd Sup | 2nd Sup | 1st Sup | Pivot | 1st Res | 2nd Res | 3rd Res |
44.69 | 45.65 | 47.21 | 48.17 | 49.73 | 50.69 | 52.25 |
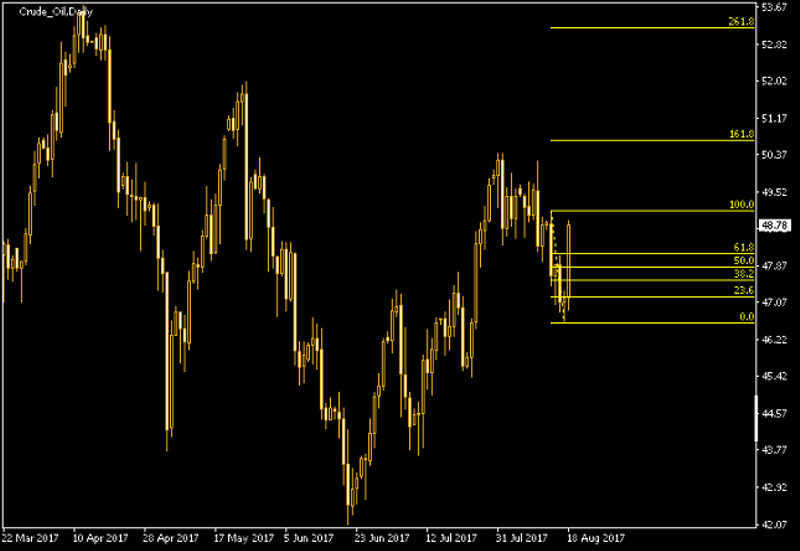
Fibonacci Retracement Levels
0.0% | 23.6% | 38.2% | 50.0% | 61.8% | 100.0% |
46.60 | 47.19 | 47.56 | 47.86 | 48.16 | 49.12 |
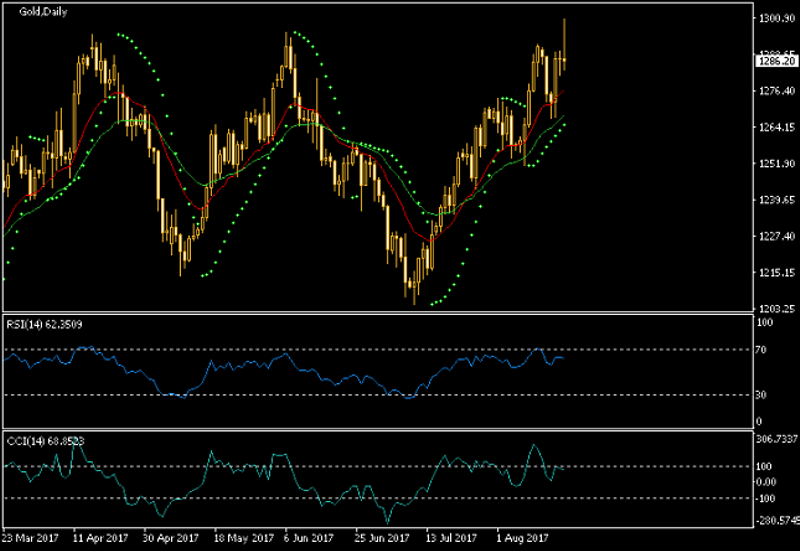
Gold
Indicators
Moving Averages | RSI | Parabolic SAR | CCI |
Long | Neutral | Long | Neutral |
Floor Pivot Points
3rd Sup | 2nd Sup | 1st Sup | Pivot | 1st Res | 2nd Res | 3rd Res |
1235.16 | 1251.11 | 1268.66 | 1284.61 | 1302.16 | 1318.11 | 1335.66 |

Fibonacci Retracement Levels
0.0% | 23.6% | 38.2% | 50.0% | 61.8% | 100.0% |
1267.07 | 1274.98 | 1279.87 | 1283.82 | 1287.77 | 1300.57 |
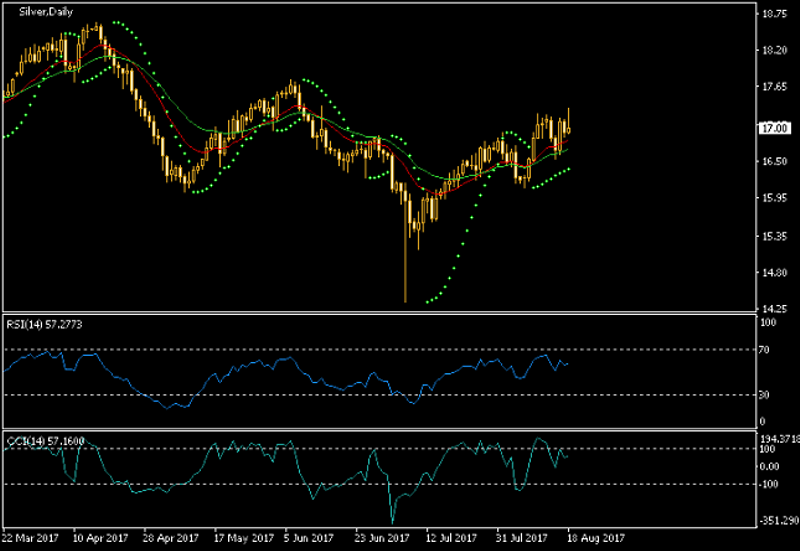
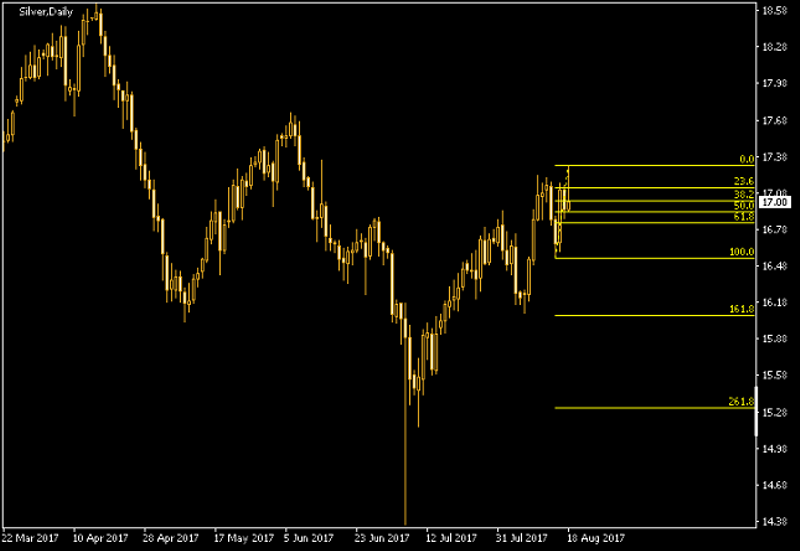
Silver
Indicators
Moving Averages | RSI | Parabolic SAR | CCI |
Long | Neutral | Long | Neutral |
Floor Pivot Points
3rd Sup | 2nd Sup | 1st Sup | Pivot | 1st Res | 2nd Res | 3rd Res |
15.83 | 16.19 | 16.59 | 16.95 | 17.35 | 17.71 | 18.11 |

Fibonacci Retracement Levels
0.0% | 23.6% | 38.2% | 50.0% | 61.8% | 100.0% |
16.54 | 16.72 | 16.83 | 16.92 | 17.01 | 17.30 |
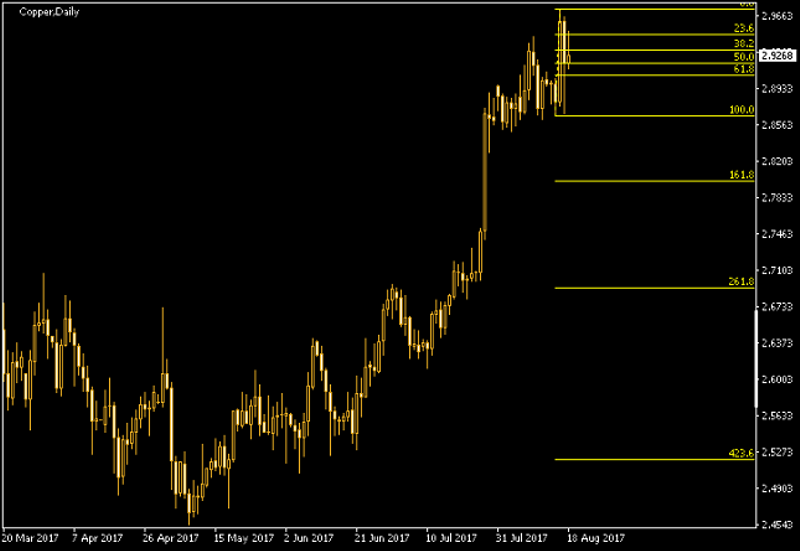
Copper
Indicators
Moving Averages | RSI | Parabolic SAR | CCI |
Long | Neutral | Long | Neutral |

Floor Pivot Points
3rd Sup | 2nd Sup | 1st Sup | Pivot | 1st Res | 2nd Res | 3rd Res |
276.39 | 281.48 | 287.08 | 292.17 | 297.77 | 302.86 | 308.46 |
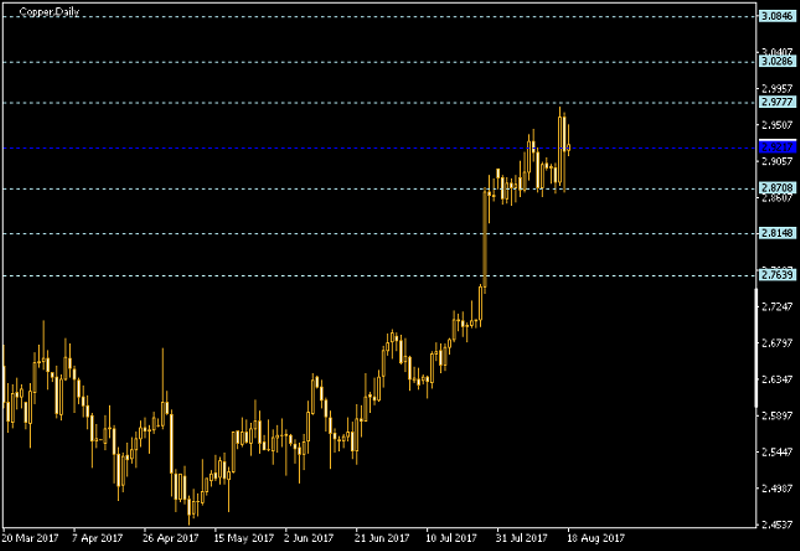
Fibonacci Retracement Levels
0.0% | 23.6% | 38.2% | 50.0% | 61.8% | 100.0% |
286.57 | 289.09 | 290.65 | 291.92 | 293.18 | 297.26 |
This post was originally published by EarnForex
This article was originally posted on FX Empire
