
 Yahoo Finance
 Could The Apollo Strategic Growth Capital (NYSE:APSG) Ownership Structure Tell Us Something Useful?
A look at the shareholders of Apollo Strategic Growth Capital (NYSE:APSG) can tell us which group is most powerful. Institutions often own shares in more established companies, while it's not unusual to see insiders own a fair bit of smaller companies. Companies that have been privatized tend to have low insider ownership.
With a market capitalization of US$991m, Apollo Strategic Growth Capital is a decent size, so it is probably on the radar of institutional investors. Taking a look at our data on the ownership groups (below), it seems that institutions own shares in the company. Let's delve deeper into each type of owner, to discover more about Apollo Strategic Growth Capital.
See our latest analysis for Apollo Strategic Growth Capital
What Does The Institutional Ownership Tell Us About Apollo Strategic Growth Capital?
Institutional investors commonly compare their own returns to the returns of a commonly followed index. So they generally do consider buying larger companies that are included in the relevant benchmark index.
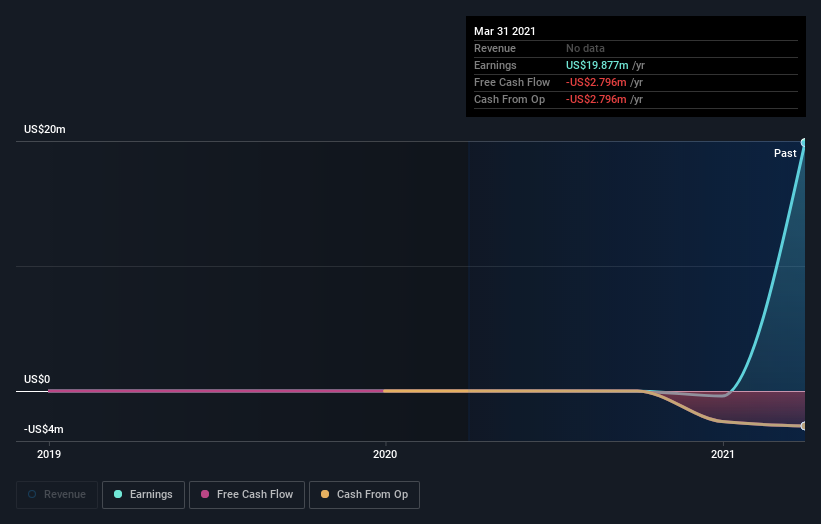
We can see that Apollo Strategic Growth Capital does have institutional investors; and they hold a good portion of the company's stock. This implies the analysts working for those institutions have looked at the stock and they like it. But just like anyone else, they could be wrong. When multiple institutions own a stock, there's always a risk that they are in a 'crowded trade'. When such a trade goes wrong, multiple parties may compete to sell stock fast. This risk is higher in a company without a history of growth. You can see Apollo Strategic Growth Capital's historic earnings and revenue below, but keep in mind there's always more to the story.
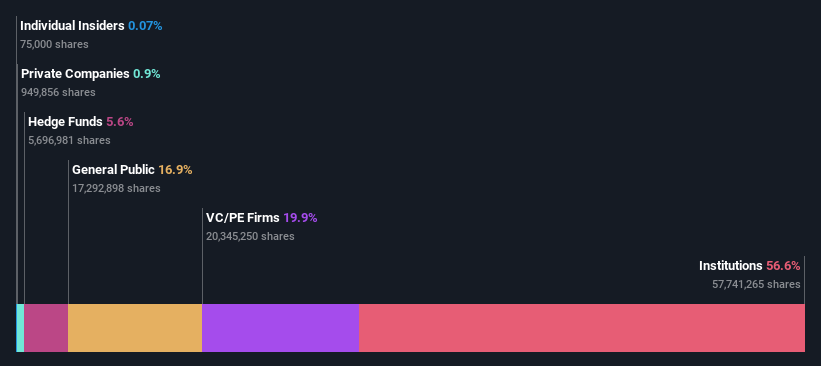
Investors should note that institutions actually own more than half the company, so they can collectively wield significant power. It would appear that 5.6% of Apollo Strategic Growth Capital shares are controlled by hedge funds. That worth noting, since hedge funds are often quite active investors, who may try to influence management. Many want to see value creation (and a higher share price) in the short term or medium term. Apollo Global Management, Inc. is currently the company's largest shareholder with 20% of shares outstanding. With 5.6% and 4.8% of the shares outstanding respectively, Empyrean Capital Partners, LP and Adage Capital Management, L.P. are the second and third largest shareholders.
We also observed that the top 10 shareholders account for more than half of the share register, with a few smaller shareholders to balance the interests of the larger ones to a certain extent.
Researching institutional ownership is a good way to gauge and filter a stock's expected performance. The same can be achieved by studying analyst sentiments. As far I can tell there isn't analyst coverage of the company, so it is probably flying under the radar.
Insider Ownership Of Apollo Strategic Growth Capital
The definition of an insider can differ slightly between different countries, but members of the board of directors always count. Company management run the business, but the CEO will answer to the board, even if he or she is a member of it.
Most consider insider ownership a positive because it can indicate the board is well aligned with other shareholders. However, on some occasions too much power is concentrated within this group.
Our information suggests that Apollo Strategic Growth Capital insiders own under 1% of the company. It appears that the board holds about US$728k worth of stock. This compares to a market capitalization of US$991m. Many tend to prefer to see a board with bigger shareholdings. A good next step might be to take a look at this free summary of insider buying and selling.
General Public Ownership
The general public, with a 17% stake in the company, will not easily be ignored. While this size of ownership may not be enough to sway a policy decision in their favour, they can still make a collective impact on company policies.
Private Equity Ownership
With a stake of 20%, private equity firms could influence the Apollo Strategic Growth Capital board. Some investors might be encouraged by this, since private equity are sometimes able to encourage strategies that help the market see the value in the company. Alternatively, those holders might be exiting the investment after taking it public.
Next Steps:
It's always worth thinking about the different groups who own shares in a company. But to understand Apollo Strategic Growth Capital better, we need to consider many other factors. Consider for instance, the ever-present spectre of investment risk. We've identified 2 warning signs with Apollo Strategic Growth Capital , and understanding them should be part of your investment process.
Of course this may not be the best stock to buy. Therefore, you may wish to see our free collection of interesting prospects boasting favorable financials.
NB: Figures in this article are calculated using data from the last twelve months, which refer to the 12-month period ending on the last date of the month the financial statement is dated. This may not be consistent with full year annual report figures.
This article by Simply Wall St is general in nature. We provide commentary based on historical data and analyst forecasts only using an unbiased methodology and our articles are not intended to be financial advice. It does not constitute a recommendation to buy or sell any stock, and does not take account of your objectives, or your financial situation. We aim to bring you long-term focused analysis driven by fundamental data. Note that our analysis may not factor in the latest price-sensitive company announcements or qualitative material. Simply Wall St has no position in any stocks mentioned.
Have feedback on this article? Concerned about the content? Get in touch with us directly. Alternatively, email editorial-team (at) simplywallst.com.
