
 Yahoo Finance
 Crude Oil May Be Bottoming, SPX 500 Threatens Monthly Uptrend
DailyFX.com -
Talking Points:
US Dollar Waiting for Follow-Through on Reversal Signal
S&P 500 Drops for Fourth Day, Threatens Monthly Uptrend
Gold Stalls at December Top, Crude Oil May Be Bottoming
Can’t access the Dow Jones FXCM US Dollar Index? Try the USD basket on Mirror Trader. **
US DOLLAR TECHNICAL ANALYSIS – Prices look likely to continue downward following the appearance of a bearish Evening Star candle pattern having reversed as expected. A daily close below the 14.6% Fibonacci retracementat 11599 exposes the 23.6% level at 11527. Alternatively, a reversal above the 23.6% Fib expansion at 11699 opens the door for a challenge of the 38.2% threshold at 11796.
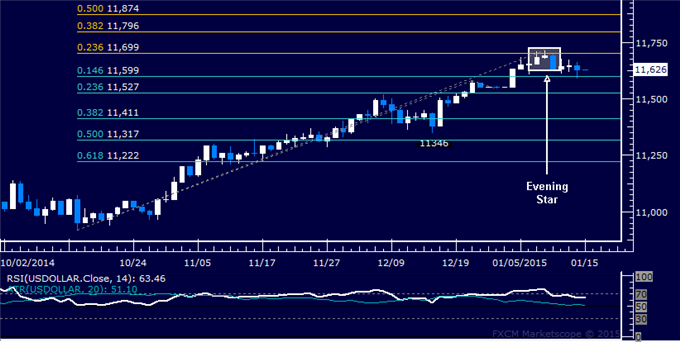
Daily Chart - Created Using FXCM Marketscope
** The Dow Jones FXCM US Dollar Index and the Mirror Trader USD basket are not the same product.
S&P 500 TECHNICAL ANALYSIS – Prices declined as expected after putting in a bearish Evening Star candlestick pattern. A secondary top may now be in place as a corrective bounce is capped by a Dark Cloud Cover formation. Breaking below rising trend line support at 2012.20 on a daily closing basis exposes the 38.2% level at 1988.00. Alternatively, a reversal back above the 23.6% Fib at 2028.00 aims for the January 9 high at 2068.60.

Daily Chart - Created Using FXCM Marketscope
GOLD TECHNICAL ANALYSIS – Prices put in a pair of Shooting Star candlesticks below resistance marked by the 61.8% Fibonacci expansion at 1233.62, hinting a pullback may be ahead. A break below the 50% level at 1220.88 exposes for the 38.2% Fib at 1208.13. Alternatively, a push above 1233.62 targets the 1249.39-55.20 area (76.4% Fib, October 21 high).
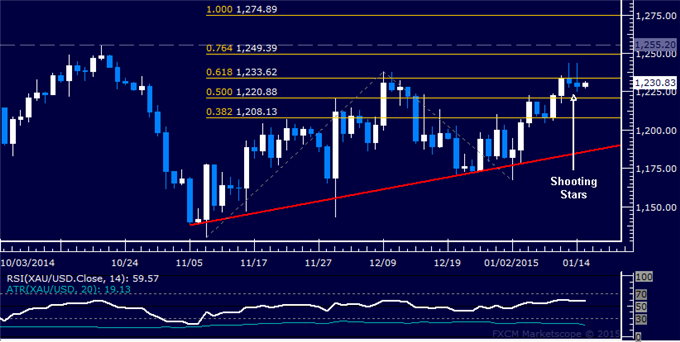
Daily Chart - Created Using FXCM Marketscope
CRUDE OIL TECHNICAL ANALYSIS – Prices rebounded as expected, completing a bullish Morning Star candlestick pattern to hint a near-term bottom may be in place. A break above 50.49, the intersection of falling channel top resistance and the 14.6% Fibonacci expansion, exposes the 23.6% level at 53.77.Near-term support is at 45.17, the January 13 low.

Daily Chart - Created Using FXCM Marketscope
--- Written by Ilya Spivak, Currency Strategist for DailyFX.com
To receive Ilya's analysis directly via email, please SIGN UP HERE
Contact and follow Ilya on Twitter: @IlyaSpivak
DailyFX provides forex news and technical analysis on the trends that influence the global currency markets.
Learn forex trading with a free practice account and trading charts from FXCM.
