
 Yahoo Finance
 Crude Oil Price Update – Big Range Potential: Upside Target $72.86, Downside Target $63.42
Nearby U.S. West Texas Intermediate crude oil futures hit their highest level since late 2014 last week as investors responded to a drop in U.S. inventories. Additionally, the market continued to be underpinned by a tightening of supply led by OPEC’s strategy to limit production. Speculators are also betting on possible supply disruptions due to the reimposition of sanctions on Iran and turmoil in Venezuela.
June WTI crude oil futures settled at $68.40, up $1.07 or +1.59%.
Weekly Swing Chart Technical Analysis
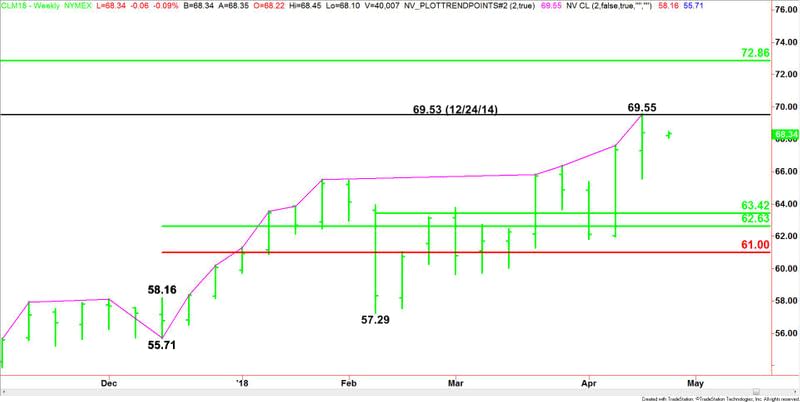
The main trend is up according to the weekly swing chart. A trade through $69.55 will signal a resumption of the uptrend. Due to the prolonged move up in terms of price and time, traders should watch for a closing price reversal top. This chart pattern won’t mean the trend is changing to down, but it could be an indication that the selling is greater than the buying at current price levels.
Last week, buyers took out the December 24, 2014 minor top at $69.53, but broke below into the close for the week. This may be an indication that the attempted breakout was fueled by buy stops rather than aggressive buying.
If the hedge funds back away from buying strength then we could see a near-term pullback into support.
There are two important targets over $69.55. The first is a gap on the weekly chart at $71.37 to $73.19. This was formed the week-ending December 12, 2014.
The second target is the contract range’s 50% level at $72.86.
On the downside, a minor 50% level comes in at $63.42. The short-term range is $55.71 to $69.55. Its retracement zone at $62.63 to $61.00 is another retracement zone target.
Weekly Swing Chart Technical Forecast
This week’s direction will be determined by trader reaction to last week’s high at $69.55.
Firstly, the buying could be strong enough to drive prices through $69.55. This could create the upside momentum needed to eventually challenge $72.86.
Secondly, buyers could take out $69.55 then break back under last week’s close at $68.40. This would put the market in a position to form a potentially bearish closing price reversal top.
Finally, the selling may be strong enough throughout the week to prevent a move over $69.55. In this case, if there is enough downside momentum, we could see the start of a move into at least $63.42 over the near-term.
This article was originally posted on FX Empire
