
 Yahoo Finance
 Disney (DIS) Q3 Earnings Beat Estimates, Revenues Up Y/Y
The Walt Disney Company DIS reported third-quarter fiscal 2023 adjusted earnings of $1.03 per share, beating the Zacks Consensus Estimate by 4.04% but declining 5.5% year over year.
Revenues increased 3.8% year over year to $22.33 billion but missed the consensus mark by 0.48%.
Disney shares have gained 4% year to date, underperforming the Zacks Consumer Discretionary sector’s growth of 13.5%.
Segment Details
Media and Entertainment Distribution (62.7% of revenues) revenues decreased 0.8% year over year to $14 billion.
Revenues from Linear Networks declined 6.9% year over year to $6.69 billion. Direct-to-Consumer revenues increased 9.2% year over year to $5.53 billion. Content Sales/Licensing and Other revenues decreased 1.4% year over year to $2.08 billion.
The Walt Disney Company Price, Consensus and EPS Surprise
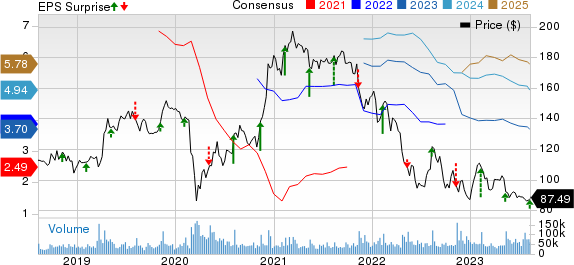
The Walt Disney Company price-consensus-eps-surprise-chart | The Walt Disney Company Quote
Parks, Experiences and Products revenues (37.3% of revenues) increased 12.6% year over year to $8.33 billion. Domestic revenues were $5.65 billion, up 4.2% year over year. International revenues jumped 94.4% year over year to $1.53 billion in the reported quarter.
Meanwhile, revenues from Disney’s Consumer Products decreased 3.2% year over year to $1.15 billion.
Subscriber Details
ESPN+ had 25.2 million paid subscribers at the end of the fiscal third quarter compared with 25.3 million at the end of the previous quarter.
Disney+, as of Jul 1, 2023, had 146.1 million paid subscribers compared with 157.8 million as of Apr 1, 2023.
Meanwhile, Disney’s Hulu ended the quarter with 48.3 million paid subscribers, up from 48.2 million reported in the previous quarter.
The average monthly revenues per paid subscriber for ESPN+ decreased 3% year over year to $5.45.
The average monthly revenues per paid subscriber for Disney+ core came in at $6.58, up 2% year over year.
The average monthly revenues per paid subscriber for Disney’s Hulu SVOD-only service increased 6% year over year to $12.39.
The average monthly revenues per paid subscriber for Disney’s Hulu Live TV + SVOD service declined 1% from the year-ago quarter to $91.80.
Operating Details
Costs & expenses increased 3.2% year over year to $19.69 billion in the reported quarter.
Segmental operating income was $3.56 billion, down 0.2% year over year.
Media and Entertainment Distribution’s segmental operating income declined 17.9% year over year to $1.13 billion.
Linear Networks’ operating income decreased 23.5% to $1.89 billion.
Direct-to-Consumer operating loss was $512 million, narrower than the year-ago quarter’s loss of $1.06 billion.
Content Sales/Licensing and Other operating losses were $243 million compared with an operating loss of $27 million reported in the year-ago quarter.
Parks, Experiences and Products’ operating income was $2.43 billion, up 10.9% year over year.
The Domestic segment reported an operating income of $1.44 billion, down 13% year over year. The International segment reported an operating income of $428 million against an operating loss of $64 million reported in the year-ago quarter.
Consumer Products’ operating profit decreased 6.3% year over year to $561 million.
Balance Sheet
As of Jul 1, 2023, cash and cash equivalents were $11.46 billion compared with $10.4 billion as of Apr 1, 2023.
Total borrowings were $47.19 billion as of Jul 1, 2023 compared with $48.52 billion as of Apr 1, 2023.
Free cash flow was $1.64 billion in the reported quarter compared with free cash flow of $1.99 billion in the previous quarter.
Zacks Rank & Stocks to Consider
Disney currently has a Zacks Rank #3 (Hold).
Afya Limited AFYA, ON Holding ONON and LiveOne LVO are some better-ranked stocks that investors can consider in the broader sector. Afya and On Holding sport Zacks Rank #1 (Strong Buy) each, while LiveOne carries a Zacks Rank #2 (Buy). You can see the complete list of today’s Zacks #1 Rank stocks here.
Afya is set to announce second-quarter 2023 results on Aug 28. AFYA shares have declined 0.6% year to date.
On Holding is set to announce second-quarter 2023 results on Aug 15. ONON shares have gained 112% year to date.
LiveOne is set to announce first-quarter fiscal 2024 results on Aug 10. LVO shares have gained 158% year to date.
Want the latest recommendations from Zacks Investment Research? Today, you can download 7 Best Stocks for the Next 30 Days. Click to get this free report
The Walt Disney Company (DIS) : Free Stock Analysis Report
Afya Limited (AFYA) : Free Stock Analysis Report
On Holding AG (ONON) : Free Stock Analysis Report
LiveOne, Inc. (LVO) : Free Stock Analysis Report
