
 Yahoo Finance
 Does 3M Company’s (NYSE:MMM) Debt Level Pose A Problem?

The size of 3M Company (NYSE:MMM), a US$121.66B large-cap, often attracts investors seeking a reliable investment in the stock market. One reason being its ‘too big to fail’ aura which gives it the appearance of a strong and stable investment. However, the health of the financials determines whether the company continues to succeed. Today we will look at 3M’s financial liquidity and debt levels, which are strong indicators for whether the company can weather economic downturns or fund strategic acquisitions for future growth. Remember this is a very top-level look that focuses exclusively on financial health, so I recommend a deeper analysis into MMM here. View our latest analysis for 3M
How does MMM’s operating cash flow stack up against its debt?
MMM’s debt levels surged from US$11.70B to US$14.01B over the last 12 months , which is made up of current and long term debt. With this increase in debt, MMM’s cash and short-term investments stands at US$4.13B , ready to deploy into the business. Additionally, MMM has produced US$6.24B in operating cash flow in the last twelve months, leading to an operating cash to total debt ratio of 44.54%, meaning that MMM’s operating cash is sufficient to cover its debt. This ratio can also be interpreted as a measure of efficiency as an alternative to return on assets. In MMM’s case, it is able to generate 0.45x cash from its debt capital.
Can MMM meet its short-term obligations with the cash in hand?
At the current liabilities level of US$7.69B liabilities, the company has been able to meet these commitments with a current assets level of US$14.28B, leading to a 1.86x current account ratio. Usually, for Industrials companies, this is a suitable ratio as there’s enough of a cash buffer without holding too capital in low return investments.
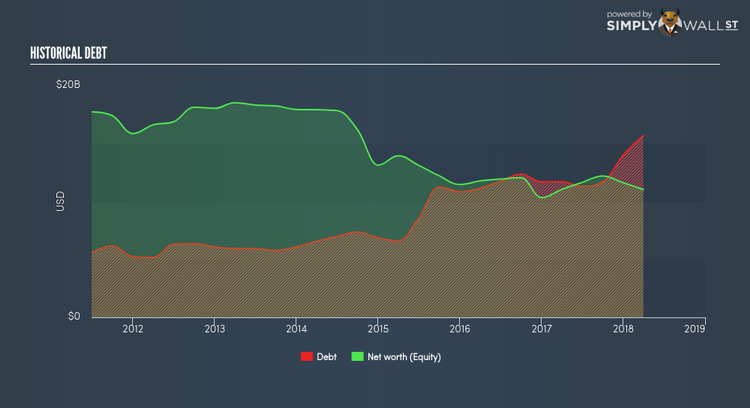
Can MMM service its debt comfortably?
3M is a highly levered company given that total debt exceeds equity. This isn’t surprising for large-caps, as equity can often be more expensive to issue than debt, plus interest payments are tax deductible. Consequently, larger-cap organisations tend to enjoy lower cost of capital as a result of easily attained financing, providing an advantage over smaller companies. No matter how high the company’s debt, if it can easily cover the interest payments, it’s considered to be efficient with its use of excess leverage. As a rule of thumb, a company should have earnings before interest and tax (EBIT) of at least three times the size of net interest. For MMM, the ratio of 22.31x suggests that interest is amply covered. Large-cap investments like MMM are often believed to be a safe investment due to their ability to pump out ample earnings multiple times its interest payments.
Next Steps:
Although MMM’s debt level is towards the higher end of the spectrum, its cash flow coverage seems adequate to meet obligations which means its debt is being efficiently utilised. This may mean this is an optimal capital structure for the business, given that it is also meeting its short-term commitment. This is only a rough assessment of financial health, and I’m sure MMM has company-specific issues impacting its capital structure decisions. I suggest you continue to research 3M to get a better picture of the large-cap by looking at:
Future Outlook: What are well-informed industry analysts predicting for MMM’s future growth? Take a look at our free research report of analyst consensus for MMM’s outlook.
Valuation: What is MMM worth today? Is the stock undervalued, even when its growth outlook is factored into its intrinsic value? The intrinsic value infographic in our free research report helps visualize whether MMM is currently mispriced by the market.
Other High-Performing Stocks: Are there other stocks that provide better prospects with proven track records? Explore our free list of these great stocks here.
To help readers see pass the short term volatility of the financial market, we aim to bring you a long-term focused research analysis purely driven by fundamental data. Note that our analysis does not factor in the latest price sensitive company announcements.
The author is an independent contributor and at the time of publication had no position in the stocks mentioned.
