
 Yahoo Finance
 Does FedEx Corporation’s (NYSE:FDX) P/E Ratio Signal A Buying Opportunity?

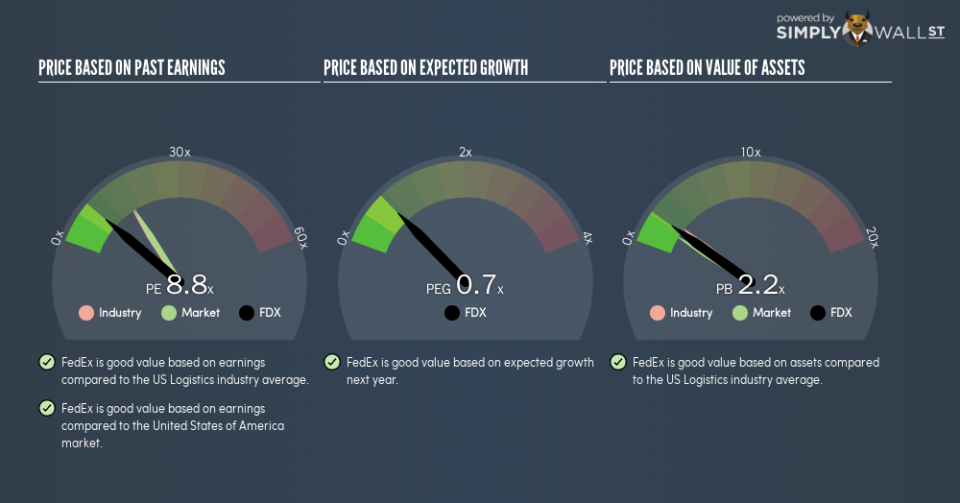
The goal of this article is to teach you how to use price to earnings ratios (P/E ratios). We’ll show how you can use FedEx Corporation’s (NYSE:FDX) P/E ratio to inform your assessment of the investment opportunity. Based on the last twelve months, FedEx’s P/E ratio is 8.76. In other words, at today’s prices, investors are paying $8.76 for every $1 in prior year profit.
View our latest analysis for FedEx
How Do You Calculate FedEx’s P/E Ratio?
The formula for P/E is:
Price to Earnings Ratio = Price per Share ÷ Earnings per Share (EPS)
Or for FedEx:
P/E of 8.76 = $164.43 ÷ $18.77 (Based on the trailing twelve months to November 2018.)
Is A High Price-to-Earnings Ratio Good?
A higher P/E ratio implies that investors pay a higher price for the earning power of the business. That is not a good or a bad thing per se, but a high P/E does imply buyers are optimistic about the future.
How Growth Rates Impact P/E Ratios
P/E ratios primarily reflect market expectations around earnings growth rates. That’s because companies that grow earnings per share quickly will rapidly increase the ‘E’ in the equation. That means unless the share price increases, the P/E will reduce in a few years. Then, a lower P/E should attract more buyers, pushing the share price up.
Notably, FedEx grew EPS by a whopping 70% in the last year. And its annual EPS growth rate over 5 years is 26%. So we’d generally expect it to have a relatively high P/E ratio.
How Does FedEx’s P/E Ratio Compare To Its Peers?
The P/E ratio essentially measures market expectations of a company. We can see in the image below that the average P/E (15.9) for companies in the logistics industry is higher than FedEx’s P/E.
Its relatively low P/E ratio indicates that FedEx shareholders think it will struggle to do as well as other companies in its industry classification. While current expectations are low, the stock could be undervalued if the situation is better than the market assumes. It is arguably worth checking if insiders are buying shares, because that might imply they believe the stock is undervalued.
Remember: P/E Ratios Don’t Consider The Balance Sheet
It’s important to note that the P/E ratio considers the market capitalization, not the enterprise value. In other words, it does not consider any debt or cash that the company may have on the balance sheet. Theoretically, a business can improve its earnings (and produce a lower P/E in the future), by taking on debt (or spending its remaining cash).
Spending on growth might be good or bad a few years later, but the point is that the P/E ratio does not account for the option (or lack thereof).
FedEx’s Balance Sheet
FedEx’s net debt is 35% of its market cap. This is a reasonably significant level of debt — all else being equal you’d expect a much lower P/E than if it had net cash.
The Bottom Line On FedEx’s P/E Ratio
FedEx trades on a P/E ratio of 8.8, which is below the US market average of 16.4. The EPS growth last year was strong, and debt levels are quite reasonable. If the company can continue to grow earnings, then the current P/E may be unjustifiably low.
When the market is wrong about a stock, it gives savvy investors an opportunity. As value investor Benjamin Graham famously said, ‘In the short run, the market is a voting machine but in the long run, it is a weighing machine.’ So this free visualization of the analyst consensus on future earnings could help you make the right decision about whether to buy, sell, or hold.
You might be able to find a better buy than FedEx. If you want a selection of possible winners, check out this free list of interesting companies that trade on a P/E below 20 (but have proven they can grow earnings).
To help readers see past the short term volatility of the financial market, we aim to bring you a long-term focused research analysis purely driven by fundamental data. Note that our analysis does not factor in the latest price-sensitive company announcements.
The author is an independent contributor and at the time of publication had no position in the stocks mentioned. For errors that warrant correction please contact the editor at editorial-team@simplywallst.com.
