
 Yahoo Finance
 Does Impellam Group PLC’s (LON:IPEL) PE Ratio Warrant A Buy?

This analysis is intended to introduce important early concepts to people who are starting to invest and want to begin learning about how to value company based on its current earnings and what are the drawbacks of this method.
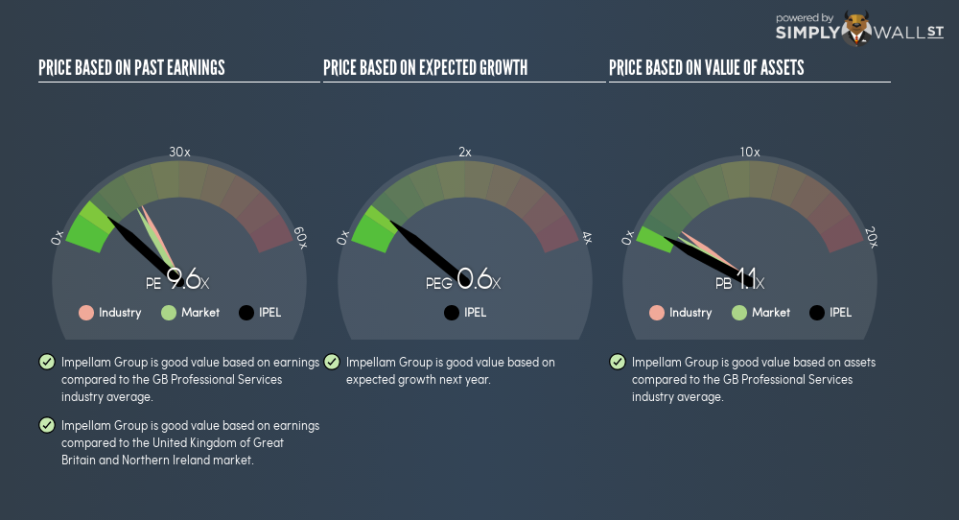
Impellam Group PLC (LON:IPEL) trades with a trailing P/E of 9.6x, which is lower than the industry average of 18.8x. Although some investors may jump to the conclusion that this is a great buying opportunity, understanding the assumptions behind the P/E ratio might change your mind. Today, I will deconstruct the P/E ratio and highlight what you need to be careful of when using the P/E ratio.
Check out our latest analysis for Impellam Group
Breaking down the Price-Earnings ratio
The P/E ratio is a popular ratio used in relative valuation since earnings power is a key driver of investment value. It compares a stock’s price per share to the stock’s earnings per share. A more intuitive way of understanding the P/E ratio is to think of it as how much investors are paying for each dollar of the company’s earnings.
P/E Calculation for IPEL
Price-Earnings Ratio = Price per share ÷ Earnings per share
IPEL Price-Earnings Ratio = £5.9 ÷ £0.616 = 9.6x
The P/E ratio itself doesn’t tell you a lot; however, it becomes very insightful when you compare it with other similar companies. We want to compare the stock’s P/E ratio to the average of companies that have similar characteristics as IPEL, such as size and country of operation. One way of gathering a peer group is to use firms in the same industry, which is what I’ll do. IPEL’s P/E of 9.6 is lower than its industry peers (18.8), which implies that each dollar of IPEL’s earnings is being undervalued by investors. This multiple is a median of profitable companies of 24 Professional Services companies in GB including Tekcapital, Mind Gym and Servoca. You can think of it like this: the market is suggesting that IPEL is a weaker business than the average comparable company.
A few caveats
Before you jump to conclusions it is important to realise that our assumptions rests on two assertions. Firstly, our peer group contains companies that are similar to IPEL. If this isn’t the case, the difference in P/E could be due to other factors. For example, if you compared lower risk firms with IPEL, then investors would naturally value it at a lower price since it is a riskier investment. The second assumption that must hold true is that the stocks we are comparing IPEL to are fairly valued by the market. If this does not hold true, IPEL’s lower P/E ratio may be because firms in our peer group are overvalued by the market.
What this means for you:
You may have already conducted fundamental analysis on the stock as a shareholder, so its current undervaluation could signal a good buying opportunity to increase your exposure to IPEL. Now that you understand the ins and outs of the PE metric, you should know to bear in mind its limitations before you make an investment decision. Remember that basing your investment decision off one metric alone is certainly not sufficient. There are many things I have not taken into account in this article and the PE ratio is very one-dimensional. If you have not done so already, I urge you to complete your research by taking a look at the following:
Future Outlook: What are well-informed industry analysts predicting for IPEL’s future growth? Take a look at our free research report of analyst consensus for IPEL’s outlook.
Past Track Record: Has IPEL been consistently performing well irrespective of the ups and downs in the market? Go into more detail in the past performance analysis and take a look at the free visual representations of IPEL’s historicals for more clarity.
Other High-Performing Stocks: Are there other stocks that provide better prospects with proven track records? Explore our free list of these great stocks here.
To help readers see past the short term volatility of the financial market, we aim to bring you a long-term focused research analysis purely driven by fundamental data. Note that our analysis does not factor in the latest price-sensitive company announcements.
The author is an independent contributor and at the time of publication had no position in the stocks mentioned. For errors that warrant correction please contact the editor at editorial-team@simplywallst.com.
