
 Yahoo Finance
 Does Liquidity Services Inc’s (NASDAQ:LQDT) Past Performance Indicate A Stronger Future?

When Liquidity Services Inc (NASDAQ:LQDT) announced its most recent earnings (31 March 2018), I did two things: looked at its past earnings track record, then look at what is happening in the industry. Understanding how Liquidity Services performed requires a benchmark rather than trying to assess a standalone number at one point in time. Below is a quick commentary on how I see LQDT has performed. View our latest analysis for Liquidity Services
How LQDT fared against its long-term earnings performance and its industry
I like to use the ‘latest twelve-month’ data, which annualizes the most recent half-year data, or in some cases, the latest annual report is already the most recent financial year data. This blend allows me to assess many different companies on a similar basis, using the latest information. For Liquidity Services, its latest trailing-twelve-month earnings is -US$29.45M, which, in comparison to the previous year’s level, has become less negative. Given that these values may be somewhat short-term thinking, I have estimated an annualized five-year figure for Liquidity Services’s net income, which stands at -US$9.03M. This shows that, Liquidity Services has historically performed better than recently, even though it seems like earnings are now heading back towards a more favorable position once more.
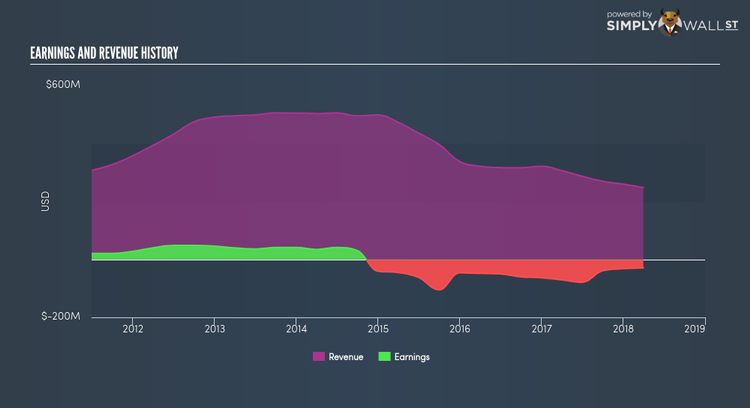
We can further assess Liquidity Services’s loss by looking at what the industry has been experiencing over the past few years. Each year, for the past five years Liquidity Services has seen an annual decline in revenue of -6.12%, on average. This adverse movement is a driver of the company’s inability to reach breakeven. Has the entire industry experienced this headwind? Eyeballing growth from a sector-level, the US internet industry has been growing its average earnings by double-digit 26.70% over the previous year, and 18.27% over the past half a decade. This suggests that, despite the fact that Liquidity Services is currently running a loss, it may have benefited from industry tailwinds, moving earnings into a more favorable position.
What does this mean?
Liquidity Services’s track record can be a valuable insight into its earnings performance, but it certainly doesn’t tell the whole story. Companies that incur net loss is always difficult to predict what will occur going forward, and when. The most valuable step is to assess company-specific issues Liquidity Services may be facing and whether management guidance has consistently been met in the past. You should continue to research Liquidity Services to get a better picture of the stock by looking at:
Financial Health: Is LQDT’s operations financially sustainable? Balance sheets can be hard to analyze, which is why we’ve done it for you. Check out our financial health checks here.
Other High-Performing Stocks: Are there other stocks that provide better prospects with proven track records? Explore our free list of these great stocks here.
NB: Figures in this article are calculated using data from the trailing twelve months from 31 March 2018. This may not be consistent with full year annual report figures.
To help readers see pass the short term volatility of the financial market, we aim to bring you a long-term focused research analysis purely driven by fundamental data. Note that our analysis does not factor in the latest price sensitive company announcements.
The author is an independent contributor and at the time of publication had no position in the stocks mentioned.
