
 Yahoo Finance
 Does Telstra Corporation Limited’s (ASX:TLS) Debt Level Pose A Problem?

There are a number of reasons that attract investors towards large-cap companies such as Telstra Corporation Limited (ASX:TLS), with a market cap of AU$37.30b. Market participants who are conscious of risk tend to search for large firms, attracted by the prospect of varied revenue sources and strong returns on capital. But, its financial health remains the key to continued success. This article will examine Telstra’s financial liquidity and debt levels to get an idea of whether the company can deal with cyclical downturns and maintain funds to accommodate strategic spending for future growth. Note that this commentary is very high-level and solely focused on financial health, so I suggest you dig deeper yourself into TLS here.
Check out our latest analysis for Telstra
Does TLS produce enough cash relative to debt?
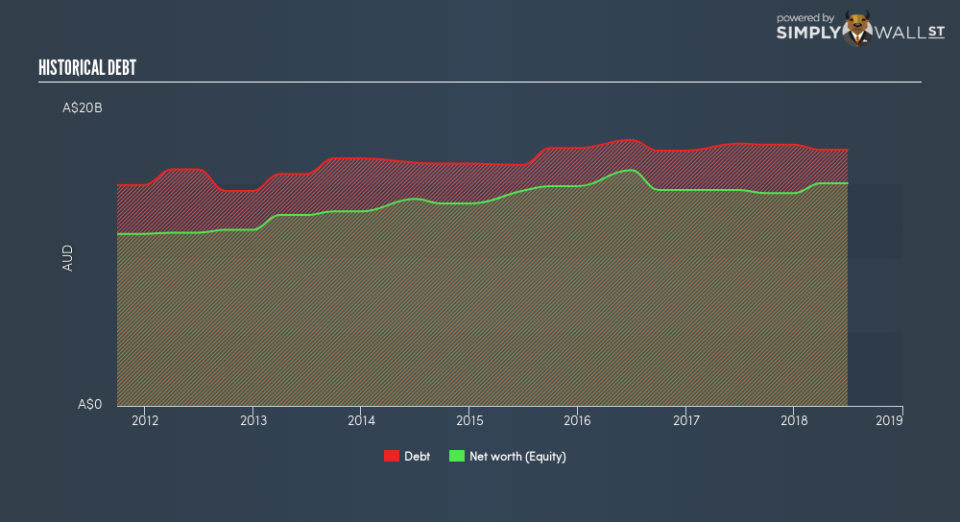
TLS’s debt level has been constant at around AU$17.29b over the previous year comprising of short- and long-term debt. At this constant level of debt, TLS currently has AU$632.0m remaining in cash and short-term investments , ready to deploy into the business. On top of this, TLS has produced AU$8.61b in operating cash flow during the same period of time, leading to an operating cash to total debt ratio of 49.8%, meaning that TLS’s operating cash is sufficient to cover its debt. This ratio can also be interpreted as a measure of efficiency as an alternative to return on assets. In TLS’s case, it is able to generate 0.5x cash from its debt capital.
Can TLS pay its short-term liabilities?
Looking at TLS’s most recent AU$8.82b liabilities, it seems that the business has not been able to meet these commitments with a current assets level of AU$7.08b, leading to a 0.8x current account ratio. which is under the appropriate industry ratio of 3x.
Does TLS face the risk of succumbing to its debt-load?
Since equity is smaller than total debt levels, Telstra is considered to have high leverage. This isn’t surprising for large-caps, as equity can often be more expensive to issue than debt, plus interest payments are tax deductible. Accordingly, large companies often have an advantage over small-caps through lower cost of capital due to cheaper financing. We can test if TLS’s debt levels are sustainable by measuring interest payments against earnings of a company. As a rule of thumb, a company should have earnings before interest and tax (EBIT) of at least three times the size of net interest. In TLS’s case, the ratio of 5.53x suggests that interest is well-covered. High interest coverage serves as an indication of the safety of a company, which highlights why many large organisations like TLS are considered a risk-averse investment.
Next Steps:
Although TLS’s debt level is towards the higher end of the spectrum, its cash flow coverage seems adequate to meet debt obligations which means its debt is being efficiently utilised. Though its low liquidity raises concerns over whether current asset management practices are properly implemented for the large-cap. Keep in mind I haven’t considered other factors such as how TLS has been performing in the past. I recommend you continue to research Telstra to get a better picture of the stock by looking at:
Future Outlook: What are well-informed industry analysts predicting for TLS’s future growth? Take a look at our free research report of analyst consensus for TLS’s outlook.
Valuation: What is TLS worth today? Is the stock undervalued, even when its growth outlook is factored into its intrinsic value? The intrinsic value infographic in our free research report helps visualize whether TLS is currently mispriced by the market.
Other High-Performing Stocks: Are there other stocks that provide better prospects with proven track records? Explore our free list of these great stocks here.
To help readers see past the short term volatility of the financial market, we aim to bring you a long-term focused research analysis purely driven by fundamental data. Note that our analysis does not factor in the latest price-sensitive company announcements.
The author is an independent contributor and at the time of publication had no position in the stocks mentioned. For errors that warrant correction please contact the editor at editorial-team@simplywallst.com.
