
 Yahoo Finance
 Don't Sell Cleanaway Waste Management Limited (ASX:CWY) Before You Read This
The goal of this article is to teach you how to use price to earnings ratios (P/E ratios). We'll look at Cleanaway Waste Management Limited's (ASX:CWY) P/E ratio and reflect on what it tells us about the company's share price. Cleanaway Waste Management has a price to earnings ratio of 39.88, based on the last twelve months. That corresponds to an earnings yield of approximately 2.5%.
View our latest analysis for Cleanaway Waste Management
How Do You Calculate A P/E Ratio?
The formula for price to earnings is:
Price to Earnings Ratio = Price per Share ÷ Earnings per Share (EPS)
Or for Cleanaway Waste Management:
P/E of 39.88 = A$2.34 ÷ A$0.059 (Based on the year to December 2018.)
Is A High P/E Ratio Good?
A higher P/E ratio means that investors are paying a higher price for each A$1 of company earnings. That isn't a good or a bad thing on its own, but a high P/E means that buyers have a higher opinion of the business's prospects, relative to stocks with a lower P/E.
How Does Cleanaway Waste Management's P/E Ratio Compare To Its Peers?
We can get an indication of market expectations by looking at the P/E ratio. You can see in the image below that the average P/E (21.8) for companies in the commercial services industry is lower than Cleanaway Waste Management's P/E.
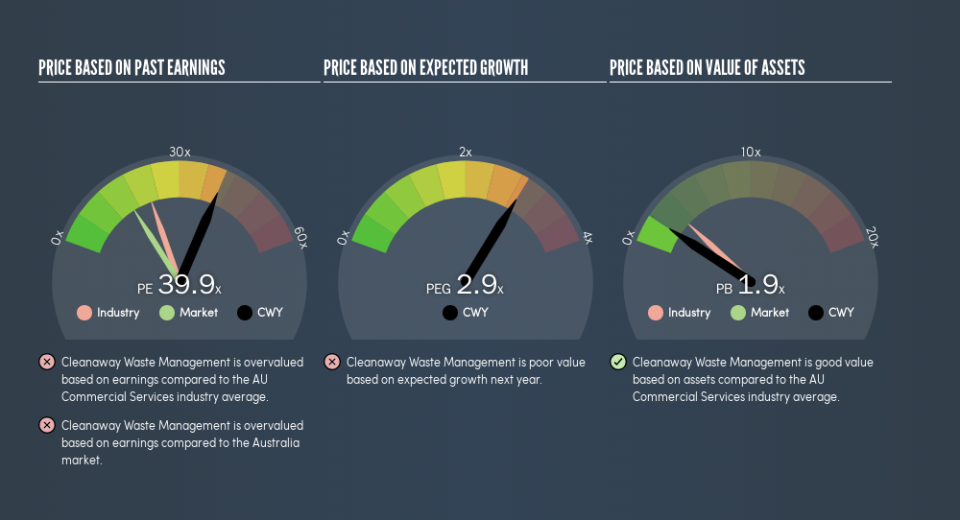
That means that the market expects Cleanaway Waste Management will outperform other companies in its industry. Clearly the market expects growth, but it isn't guaranteed. So further research is always essential. I often monitor director buying and selling.
How Growth Rates Impact P/E Ratios
Earnings growth rates have a big influence on P/E ratios. Earnings growth means that in the future the 'E' will be higher. That means even if the current P/E is high, it will reduce over time if the share price stays flat. And as that P/E ratio drops, the company will look cheap, unless its share price increases.
Cleanaway Waste Management's earnings per share grew by -8.3% in the last twelve months. And earnings per share have improved by 29% annually, over the last three years.
Don't Forget: The P/E Does Not Account For Debt or Bank Deposits
Don't forget that the P/E ratio considers market capitalization. Thus, the metric does not reflect cash or debt held by the company. In theory, a company can lower its future P/E ratio by using cash or debt to invest in growth.
Spending on growth might be good or bad a few years later, but the point is that the P/E ratio does not account for the option (or lack thereof).
Cleanaway Waste Management's Balance Sheet
Net debt totals 14% of Cleanaway Waste Management's market cap. This could bring some additional risk, and reduce the number of investment options for management; worth remembering if you compare its P/E to businesses without debt.
The Bottom Line On Cleanaway Waste Management's P/E Ratio
Cleanaway Waste Management's P/E is 39.9 which is above average (16.2) in its market. With debt at prudent levels and improving earnings, it's fair to say the market expects steady progress in the future.
Investors have an opportunity when market expectations about a stock are wrong. As value investor Benjamin Graham famously said, 'In the short run, the market is a voting machine but in the long run, it is a weighing machine.' So this free report on the analyst consensus forecasts could help you make a master move on this stock.
You might be able to find a better buy than Cleanaway Waste Management. If you want a selection of possible winners, check out this free list of interesting companies that trade on a P/E below 20 (but have proven they can grow earnings).
We aim to bring you long-term focused research analysis driven by fundamental data. Note that our analysis may not factor in the latest price-sensitive company announcements or qualitative material.
If you spot an error that warrants correction, please contact the editor at editorial-team@simplywallst.com. This article by Simply Wall St is general in nature. It does not constitute a recommendation to buy or sell any stock, and does not take account of your objectives, or your financial situation. Simply Wall St has no position in the stocks mentioned. Thank you for reading.
