
 Yahoo Finance
 Dow Jones 30 and NASDAQ 100 Price Forecast January 8, 2018, Technical Analysis
Dow Jones 30
The Dow Jones 30 rallied during the day on Friday, pulled back a bit after the disappointing jobs number came out, but then rallied again to test the highs. We are clearly well above the 25,000 level now, and ready to go much higher. In fact, we came close to the 25,200 level above, so I think that it shows just how bullish the markets have become. I think that the 25,000 level should offer a bit of a “floor” in the short term, and perhaps even the long-term. Economic numbers in the United States continues to impress, save the disappointing jobs number during the day on Friday, so I think that buyers are willing to get involved, based upon the tax bill being passed.
Dow Jones 30 and NASDAQ Index Video 08.01.18
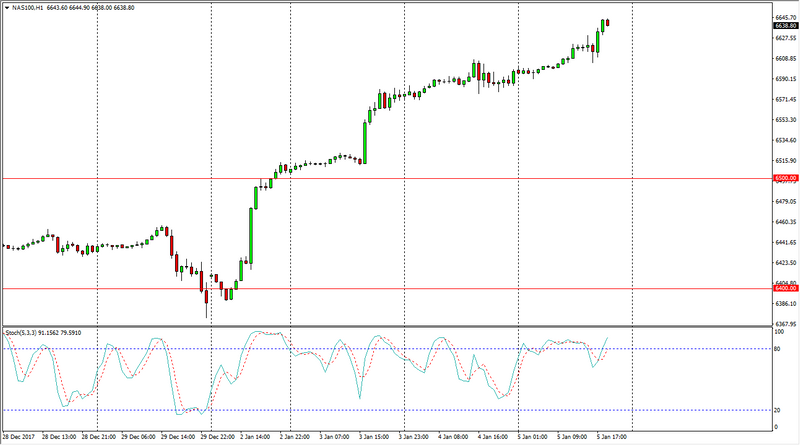
NASDAQ 100
The NASDAQ 100 rallied a bit during the trading session on Friday as well, breaking well above the 6600 level. Now that we have broken above there, the market looks likely to go even higher. We have broken above a couple of major areas, the top of an uptrend channel, and of course the 6500 level. I think that the market continues to find plenty of reasons to go higher, but the NASDAQ 100 has been a bit of a laggard when it comes to the US stock markets. Nonetheless, I’m a buyer of dips, and I do believe that the 6500 level now should offer a “floor” in the market. Expect noise, but overall bullish pressure.
This article was originally posted on FX Empire
More From FXEMPIRE:
Natural Gas Price forecast for the week of January 8, 2018, Technical Analysis
USD/JPY Price forecast for the week of January 8, 2018, Technical Analysis
FTSE 100 Price forecast for the week of January 8, 2018, Technical Analysis
S&P 500 Price forecast for the week of January 8, 2018, Technical Analysis
GBP/JPY Price forecast for the week of January 8, 2018, Technical Analysis
