
 Yahoo Finance
 Dow Jones 30 and NASDAQ 100 Price forecast for the week of October 16, 2017, Technical Analysis
Dow Jones 30
The Dow Jones 30 rallied again during the week, testing the 22,900 level. The next obvious resistance barrier will be the 23,000 handle, and although I think we get there, it would not surprise me at all to see a little bit of a pullback. After all, we are starting to get a bit parabolic, but quite frankly I have no interest in trying to short this market. I think a nice healthy pullback should be ahead of us, and that should be a very good opportunity for longer-term traders to take advantage of value in a market that has no reason to fall recently. We do have significant news coming out in the form of earnings season, but I think ultimately the buyers will return to pick up any type of dip.
Dow Jones 30 and NASDAQ Index Video 16.10.17
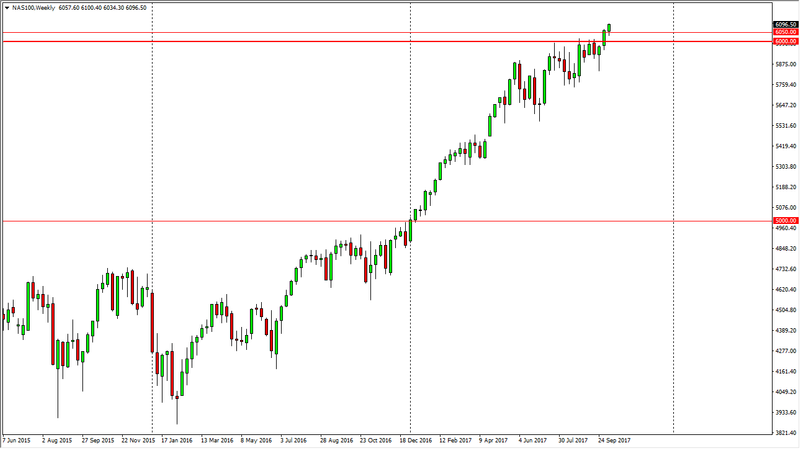
NASDAQ 100
The NASDAQ 100 initially fell during the week but found enough support below the 6050 level to turn around and form a bullish candle. The bullish candle suggests that we are going to go back towards the 6100 level again, and then breakout towards the 6200 level. The recent measured move suggested that we were going to the 6200 handle, and that is my target. I also believe we go higher than that, but I also recognize that we are bit overextended, and you can see how difficult it was to break above the 6000 level. We may need to come back to retest that area for support, but I anticipate that we will see plenty of it in that region. With this being the case, I am “by only”, but I also recognize that you may need to be patient enough to find lower pricing.
This article was originally posted on FX Empire
More From FXEMPIRE:
EUR/USD forecast for the week of October 16, 2017, Technical Analysis
NZD/USD forecast for the week of October 16, 2017, Technical Analysis
Natural Gas forecast for the week of October 16, 2017, Technical Analysis
Dow Jones 30 and NASDAQ 100 Price forecast for the week of October 16, 2017, Technical Analysis
