
 Yahoo Finance
 Dow Jones 30 and NASDAQ 100 Price forecast for the week of February 12, 2018, Technical Analysis
Dow Jones 30
The Dow Jones 30 fell hard during the week, reaching as low as 23,000 before turning around. The rally on Friday was somewhat encouraging at the end of the day, so it’s possible that we could see the market try to turn around. The 23,000 level should be supportive, but if we break down below there, I think we go down to the 20,000 level. This market has been overdone for quite some time, so this pullback, although very violent and a bit scary, should be welcomed by those who are hoping that the uptrend continues. What we need to see is bullish pressure but with less parabolic attitude.
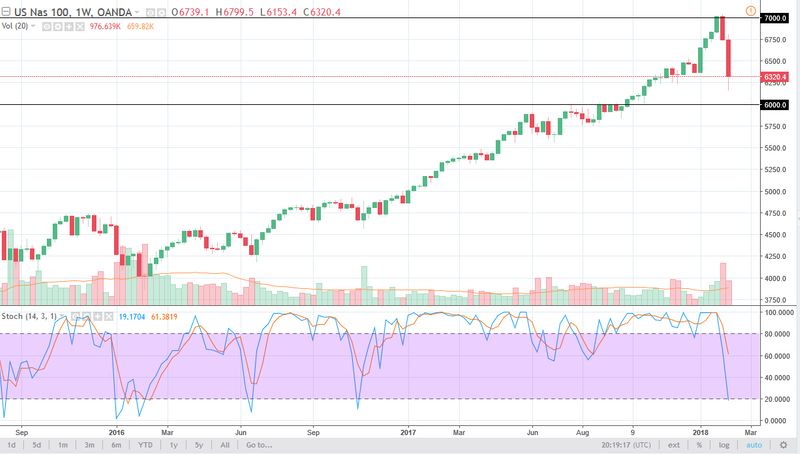
NASDAQ 100
The NASDAQ 100 has broken down significantly during the week as well, slicing through the 6500 level, and then eventually the 6250 level. However, on Friday we started to see buyers reenter the market as we ended up forming a bullish candle on the daily chart. The 6000-level underneath should be a bit of a “floor” in the market, and I think that it is only a matter of time before the buyers get involved and start pushing this market higher again. The stock markets are offering value now, so it makes sense that value hunters have come back in. If we were to break down below the 6000 handle, then that would be a very negative sign. At this point, I believe this is simply a correction of what has been far too bullish behavior lately.
Dow Jones 30 and NASDAQ Index Video 12.02.18
This article was originally posted on FX Empire
More From FXEMPIRE:
Bitcoin Price forecast for the week of February 12, 2018, Technical Analysis
USD/CAD Price forecast for the week of February 12, 2018, Technical Analysis
USD/JPY Price forecast for the week of February 12, 2018, Technical Analysis
DAX Price of forecast for the week of February 12, 2018, Technical Analysis
Natural Gas Price forecast for the week of February 12, 2018, Technical Analysis
GBP/USD Price forecast for the week of February 12, 2018, Technical Analysis
