
 Yahoo Finance
 Dow Jones 30 and NASDAQ 100 Price Forecast January 17, 2018, Technical Analysis
Dow Jones 30
The Dow Jones 30 rallied a bit during the trading session on Tuesday, reaching above the 2600 level. By breaking down below that level, it’s likely that the selloff is simply profit-taking, and I think that the market will more than likely find value underneath. Somewhere near the 25,750 level we should see buyers jump in the market based upon what is currently going on, but even if we break down below there, I believe that being patient and waiting for some type of bounce or signs of stability is probably the best way to take advantage of what will certainly be a momentum building exercise.
Dow Jones 30 and NASDAQ Index Video 17.01.18
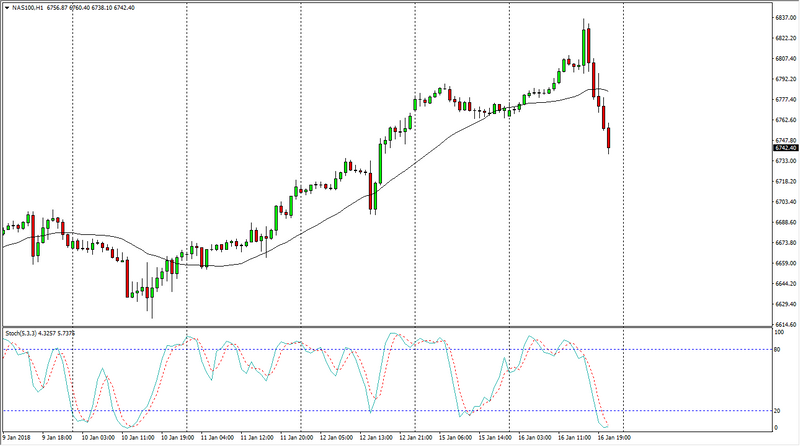
NASDAQ 100
The NASDAQ 100 initially rally during the day on Tuesday but found enough resistance at the 6025 handle to turn around and break below the highs of the day. This is a very negative sign, but at the end of the day we are in a strong uptrend, so I have no interest in shorting. I believe that the market will find plenty of reasons to go higher, so I think that if we are patient enough, the market should present itself as being strong. I think this is more profit-taking than anything else, as we have seen so much of an explosion to the upside. I would anticipate that the 6700 level offers support, and even if we break down below there I would anticipate that the 6650 level will be even more supportive.
This article was originally posted on FX Empire
