
 Yahoo Finance
 DuPont de Nemours (NYSE:DD) sheds US$1.6b, company earnings and investor returns have been trending downwards for past five years
The main aim of stock picking is to find the market-beating stocks. But even the best stock picker will only win with some selections. At this point some shareholders may be questioning their investment in DuPont de Nemours, Inc. (NYSE:DD), since the last five years saw the share price fall 76%. We also note that the stock has performed poorly over the last year, with the share price down 26%. More recently, the share price has dropped a further 12% in a month. We do note, however, that the broader market is down 9.6% in that period, and this may have weighed on the share price.
Since DuPont de Nemours has shed US$1.6b from its value in the past 7 days, let's see if the longer term decline has been driven by the business' economics.
See our latest analysis for DuPont de Nemours
While markets are a powerful pricing mechanism, share prices reflect investor sentiment, not just underlying business performance. One way to examine how market sentiment has changed over time is to look at the interaction between a company's share price and its earnings per share (EPS).
During five years of share price growth, DuPont de Nemours moved from a loss to profitability. Most would consider that to be a good thing, so it's counter-intuitive to see the share price declining. Other metrics might give us a better handle on how its value is changing over time.
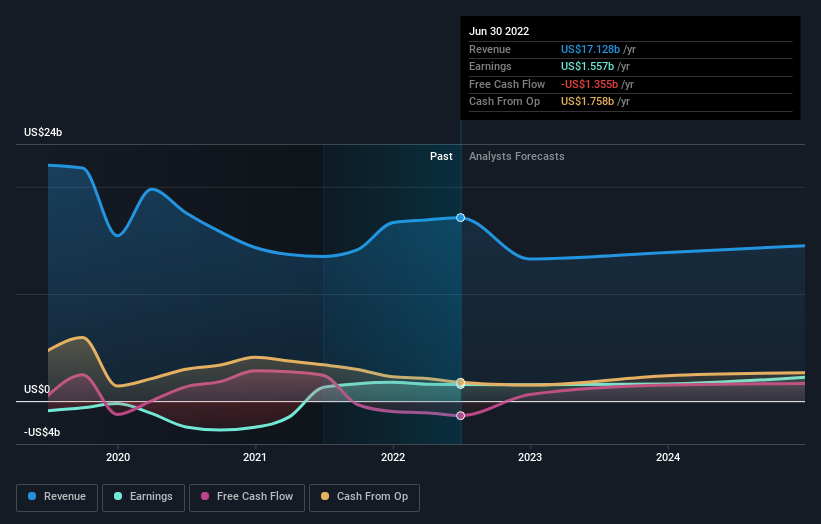
Arguably, the revenue drop of 28% a year for half a decade suggests that the company can't grow in the long term. That could explain the weak share price.
The company's revenue and earnings (over time) are depicted in the image below (click to see the exact numbers).
DuPont de Nemours is well known by investors, and plenty of clever analysts have tried to predict the future profit levels. Given we have quite a good number of analyst forecasts, it might be well worth checking out this free chart depicting consensus estimates.
What About Dividends?
It is important to consider the total shareholder return, as well as the share price return, for any given stock. The TSR incorporates the value of any spin-offs or discounted capital raisings, along with any dividends, based on the assumption that the dividends are reinvested. So for companies that pay a generous dividend, the TSR is often a lot higher than the share price return. As it happens, DuPont de Nemours' TSR for the last 5 years was -43%, which exceeds the share price return mentioned earlier. The dividends paid by the company have thusly boosted the total shareholder return.
A Different Perspective
We regret to report that DuPont de Nemours shareholders are down 24% for the year (even including dividends). Unfortunately, that's worse than the broader market decline of 22%. Having said that, it's inevitable that some stocks will be oversold in a falling market. The key is to keep your eyes on the fundamental developments. Unfortunately, last year's performance may indicate unresolved challenges, given that it was worse than the annualised loss of 7% over the last half decade. Generally speaking long term share price weakness can be a bad sign, though contrarian investors might want to research the stock in hope of a turnaround. It's always interesting to track share price performance over the longer term. But to understand DuPont de Nemours better, we need to consider many other factors. Consider for instance, the ever-present spectre of investment risk. We've identified 1 warning sign with DuPont de Nemours , and understanding them should be part of your investment process.
But note: DuPont de Nemours may not be the best stock to buy. So take a peek at this free list of interesting companies with past earnings growth (and further growth forecast).
Please note, the market returns quoted in this article reflect the market weighted average returns of stocks that currently trade on US exchanges.
Have feedback on this article? Concerned about the content? Get in touch with us directly. Alternatively, email editorial-team (at) simplywallst.com.
This article by Simply Wall St is general in nature. We provide commentary based on historical data and analyst forecasts only using an unbiased methodology and our articles are not intended to be financial advice. It does not constitute a recommendation to buy or sell any stock, and does not take account of your objectives, or your financial situation. We aim to bring you long-term focused analysis driven by fundamental data. Note that our analysis may not factor in the latest price-sensitive company announcements or qualitative material. Simply Wall St has no position in any stocks mentioned.
Join A Paid User Research Session
You’ll receive a US$30 Amazon Gift card for 1 hour of your time while helping us build better investing tools for the individual investors like yourself. Sign up here
