
 Yahoo Finance
 E-mini Dow Jones Industrial Average (YM) Futures Technical Analysis – Resumes Uptrend on Renewed Hope of Trade Deal
September E-mini Dow Jones Industrial Average futures are trading sharply higher at the mid-session after President Trump announced in a tweet that he’ll meet with Chinese President Xi Jinping at the G-20 summit in Japan later this week. The Dow surged on the hope that this meeting will lead to an eventual trade deal between the two economic powerhouses.
At 16:33 GMT, September E-mini Dow Jones Industrial Average futures are trading at 26478, up 340 or +1.30%.
The news helped drive shares of Dow components Boeing and Caterpillar, up 2.3% and 2.9% respectively. Deere shares also gained more than 3%. Semiconductor stocks also rose on Trump’s tweet.
Daily Technical Analysis
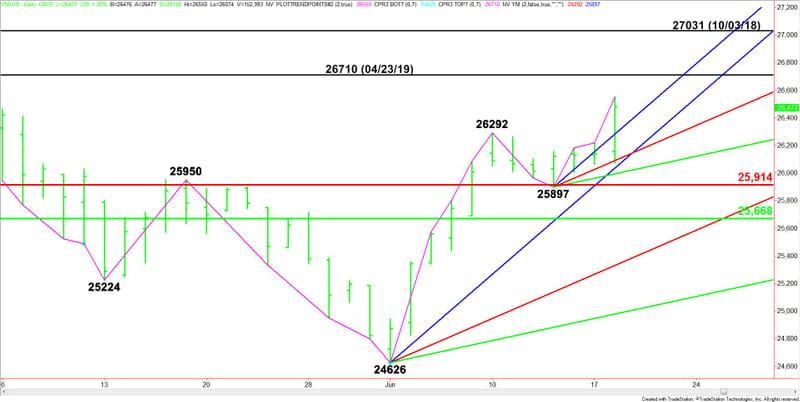
The main trend is up according to the daily swing chart. The uptrend was reaffirmed on Tuesday after buyers took out the last main bottom at 26292. A trade through 25897 will change the main trend to down.
The main range is 26710 to 24626. Its retracement zone at 25914 to 25668 is controlling the near-term direction of the market. Traders should treat this zone as support.
Daily Technical Forecast
Bullish Scenario
If the upside momentum continues then look for a breakout over the intraday high at 26550. If this move creates enough upside momentum then look for a potential rally into the April 23 main top at 26710. This is the last potential resistance level before the October 3, 2018 main top at 27031.
Bearish Scenario
If investors start to square positions or take profits ahead of Wednesday’s Fed announcements then look for a potential pullback into the short-term uptrending Gann angle at 26281. If this fails then we could see an extension of the selling into a pair of uptrending Gann angles at 26089 and 25993.
This article was originally posted on FX Empire
More From FXEMPIRE:
Natural Gas Price Prediction – Prices Tumble Ahead of EIA Report
Oil Rebounds On Bullish Data, OPEC Meeting Date Set, Trade-Optimism Fuels Demand Hopes
AUD/USD Price Forecast – Australian dollar soft on Wednesday
S&P 500 Price Forecast – Stock markets await Federal Reserve
Gold Price Futures (GC) Technical Analysis – June 19, 2019 Forecast
