
 Yahoo Finance
 E-mini NASDAQ-100 Index (NQ) Futures Technical Analysis – Sharp Rise Fueled By Dampened Rate Hike Expectations
September E-mini NASDAQ-100 Index futures are surging late Friday as signs of slowing economic growth dampened expectations for the Federal Reserve’s rate-hike plans. Investors were also reacting to a U.S. consumer survey that showed a marginal improvement in the outlook for inflation.
The catalyst fueling today’s rally was the expectation of future rate hikes coming down. This was supported by the news that Fed funds futures traders are now pricing for the benchmark rate to rise to about 3.5% by March, down from expectations last week that it would increase to around 4%.
At 18:20 GMT, September E-mini NASDAQ-100 Index futures are trading 12127.75, up 390.25 or +3.32%. The Invesco QQQ Trust ETF (QQQ) is at $295.00, up $10.15 or +3.56%.
Daily Swing Chart Technical Analysis
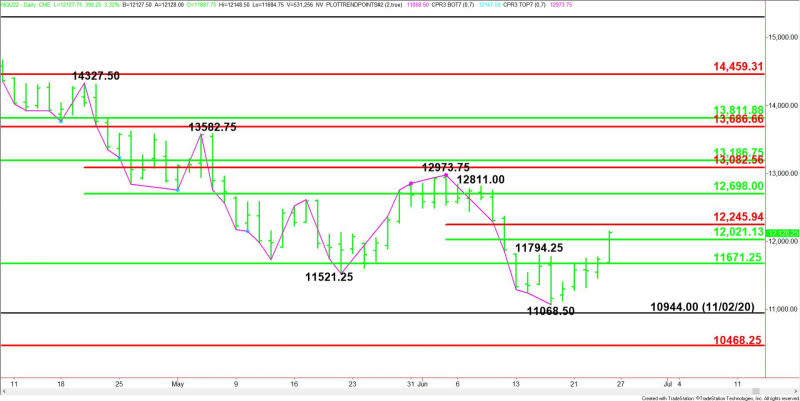
The main trend is down according to the daily swing chart. However, momentum is trending higher. A trade through 12973.75 will change the main trend to up. A move through 11068.50 will signal a resumption of the downtrend.
The minor trend is up. It changed trend when buyers took out 11794.25. This move shifted momentum to the upside.
The short-term range is 12973.75 to 11068.50. The index is currently testing its retracement zone at 12021.00 to 12246.00.
On the downside, the key support is a long-term retracement zone at 11671.25 to 10468.25. On the upside, the intermediate retracement zone at 12698.00 to 13082.50 is the next potential target.
Daily Swing Chart Technical Forecast
Trader reaction to the short-term 50% level at 12021.00 is likely to determine the direction of the September E-mini NASDAQ-100 Index into the close on Friday.
Bullish Scenario
A sustained move over 12021.00 will indicate the presence of buyers. This could trigger a late session surge into the short-term Fibonacci level at 12246.00. Sellers could come in on the first test of this level. However overtaking it could trigger an acceleration to the upside.
Bearish Scenario
A sustained move under 12021.00 will signal the presence of sellers. If this creates enough downside momentum then look for the selling to possibly extend into the long-term 50% level at 11671.25.
For a look at all of today’s economic events, check out our economic calendar.
This article was originally posted on FX Empire
More From FXEMPIRE:
Crypto Market Daily Highlights – June 24 – SOL and XRP Lead the Charge
Brazilian indigenous defender Pereira buried with traditional send-off
G7 must act to help tackle global hunger crisis-German UN food agency
Ghislaine Maxwell seeks to curb accusers’ testimony at sentencing
Ecuador opposition lawmakers push to remove president after protests
