
 Yahoo Finance
 E-mini NASDAQ-100 Index (NQ) Futures Technical Analysis – Momentum Turns Lower Under 9843.50
September E-mini NASDAQ-100 Index futures are up late in the session on Tuesday as the pace of decline in business activity slowed, bolstering hopes that the worst of the coronavirus crisis was over.
The index hit a fifth record high this month, with Apple Inc providing the biggest boost after at least three brokerages raised their price targets a day after it announced it would use its own chips for Mac computers.
At 15:26 GMT, September E-mini NASDAQ-100 Index futures are trading 10246.75, up 122.00 or +1.20%.
In other news, the pace of contraction in U.S. manufacturing and services sectors slowed in June as businesses reopened after the health crisis resulted in a lockdown in mid-March. Another set of data showed new home sales jumped 16.6% in May, blowing past estimates of a 2.9% rise.
Daily Swing Chart Technical Analysis
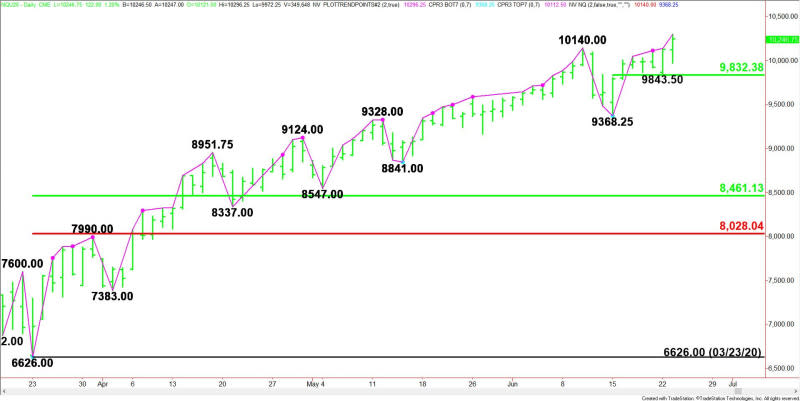
The main trend is up according to the daily swing chart. The uptrend was reaffirmed on Tuesday when buyers took out the previous main top at 10140.00. The main trend will change to down if sellers take out 9368.25.
The minor trend is also up. A trade through 9843.50 will change the minor trend to down. This will also shift momentum back to the downside.
The minor range is 9368.25 to 10296.25. Its 50% level or pivot is 9832.25. Major near-term support.
The main range is 6626.00 to 10140.00. Its retracement zone at 8461.00 to 8028.00 is major support. This zone is controlling the longer-term direction of the index.
Short-Term Outlook
The trend and momentum are both headed higher. Since there is no resistance, the only chart pattern traders need to be watching for is the closing price reversal top.
This chart pattern won’t change the main trend to down, but it will indicate the selling is greater than the buying at current price levels. At first, the chart pattern will be used to alleviate some of the upside pressure. This should lead to a normal retracement.
For a look at all of today’s economic events, check out our economic calendar.
This article was originally posted on FX Empire
