
 Yahoo Finance
 E-mini NASDAQ-100 Index (NQ) Futures Technical Analysis – Found Support Inside 7410.25 to 7521.00 Retracement Zone
Technology shares rebounded from overnight weakness to close higher for the session. There were no particular reasons for the turnaround except maybe the inability to attract aggressive sellers in front of next week’s two-day Federal Reserve meeting on June 18-19. Traders aren’t looking for policymakers to cut rates at its June meeting, but Fed Funds traders have priced in about an 85 percent chance of a rate cut in July.
At 20:57 GMT, June E-mini NASDAQ-100 Index futures are trading 7511.25, up 38.00 or +0.51%.
Daily Swing Chart Technical Analysis
The main trend is down according to the daily swing chart. However, last week’s weekly closing price reversal bottom shifted momentum to the upside.
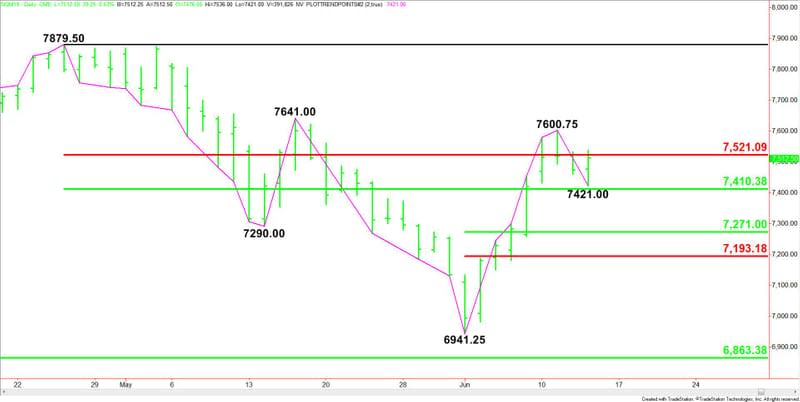
Taking out 7600.75 will change the main trend to up. A move through 7641.00 will reaffirm the uptrend. This is a potential trigger point for an acceleration into the April 25 main top at 7879.50.
The minor trend is down, but a new minor bottom has formed at 7421.00. A trade through this bottom will change the minor trend to down. This will shift momentum to the downside.
The main range is 7879.50 to 6941.25. Its retracement zone at 7410.25 to 7521.00 is controlling the near-term direction of the index.
The short-term range is 6941.25 to 7600.75. If the minor trend changes to down then look for the selling to possibly extend into its retracement zone at 7271.00 to 7193.00.
Daily Swing Chart Technical Forecast
Based on Thursday’s action, the direction of the June E-mini NASDAQ-100 Index early Friday is likely to be determined by trader reaction to the main Fibonacci level at 7521.00.
Bullish Scenario
A sustained move over 7521.00 will indicate the presence of buyers. If this creates enough upside momentum then look for buyers to try to trigger a breakout to the upside over 7600.75 and 7641.25. The latter is a potential acceleration level for a drive into the next main top at 7879.50.
Bearish Scenario
A sustained move under 7521.00 will signal the presence of sellers. If this move generates enough downside momentum then look for a drive into Thursday’s low at 7421.00 and the main 50% level at 7410.25.
The trigger point for an acceleration to the downside is 7410.25. If this move attracts enough sellers then look for a potential break into the short-term retracement zone at 7271.00 to 7193.00. Buyers could come in on a test of this zone.
This article was originally posted on FX Empire
More From FXEMPIRE:
Soft Inflation Data and Concerned Draghi. How Will Gold Like It?
Gold Price Prediction – Gold Continues Bull Flag Pattern on Safe-haven Concerns
Silver Price Forecast – Silver markets continue to grind higher
Forex Daily Recap – Aussie Pair Slipped over Disappointing Job Data
Natural Gas Price Prediction – Prices Drop on Higher Production Forecast
Natural Gas Price Forecast – Natural gas markets fall again on Thursday
