
 Yahoo Finance
 E-mini S&P 500 Index (ES) Futures Technical Analysis – February 14, 2019 Forecast
March E-mini S&P 500 Index futures are trading lower shortly before the cash market opening after giving back all of its earlier gains. The catalyst behind the selling was a weaker-than-expected retail sales report. This news offset the optimism surrounding the U.S.-China trade talks. Retail sales fell 1.2 percent in December, marking their biggest monthly drop since September 2009, according to The Commerce Department. Core retail sales were off by 1.8 percent.
At 14:05 GMT, March E-mini S&P 500 Index futures are trading 2739.75, down 9.50 or -0.25%.
Daily Technical Analysis
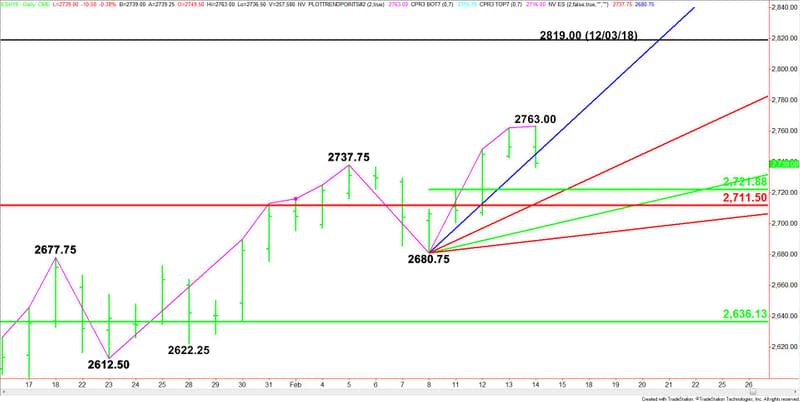
The main trend is up according to the daily swing chart. The uptrend was reaffirmed early in the session when the index traded through yesterday’s high. A trade through 2680.75 will change the main trend to down.
Given the prolonged move up in terms of price and time and today’s higher-high chart pattern, the rapid turn to the downside has put the index in a position to post a potentially bearish closing price reversal top. Although this won’t indicate a change in trend, it could trigger the start of a 2 to 3 day retracement.
The short-term range is 2680.75 to 2763.00. Its 50% level at 2721.75 is the initial downside target, followed by a major Fibonacci level at 2711.50. Since the main trend is up, look for buyers on the first test of these levels.
Daily Technical Forecast
Based on the early price action, the direction of the March E-mini S&P 500 Index the rest of the session is likely to be determined by trader reaction to the steep uptrending Gann angle at 2744.75.
Bullish Scenario
A sustained move over 2744.75 will indicate the return of buyers. The next target is yesterday’s close at 2749.50. Overcoming this level will turn the index higher, putting it in a position to challenge today’s intraday high at 2763.00.
Bearish Scenario
A sustained move under 2744.75 will signal the presence of sellers. If this move creates enough downside momentum then look for a potential acceleration into the short-term 50% level at 2721.75, followed by the uptrending Gann angle at 2712.75 and the major Fibonacci level at 2711.50.
Closing Price Reversal Top
The higher-high, lower-close chart pattern will form a closing price reversal top on the daily chart.
This article was originally posted on FX Empire
More From FXEMPIRE:
Investors on the Sidelines Awaiting Trade Negotiations Outcome
Natural Gas Price Forecast – natural gas continues to hang at low levels
Crude Oil Price Forecast – crude oil continues to press resistance
Crude Oil Price Update – Strengthens Over $55.05, Weakens Under $54.62
USD/JPY Price Forecast – US dollar nose dives that crucial EMA
