
 Yahoo Finance
 Earnings Not Telling The Story For Newegg Commerce, Inc. (NASDAQ:NEGG)
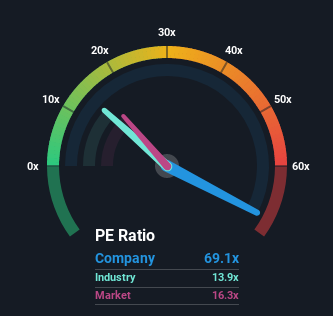
When close to half the companies in the United States have price-to-earnings ratios (or "P/E's") below 16x, you may consider Newegg Commerce, Inc. (NASDAQ:NEGG) as a stock to avoid entirely with its 69.1x P/E ratio. Although, it's not wise to just take the P/E at face value as there may be an explanation why it's so lofty.
Newegg Commerce has been doing a good job lately as it's been growing earnings at a solid pace. It might be that many expect the respectable earnings performance to beat most other companies over the coming period, which has increased investors’ willingness to pay up for the stock. If not, then existing shareholders may be a little nervous about the viability of the share price.
View our latest analysis for Newegg Commerce
Want the full picture on earnings, revenue and cash flow for the company? Then our free report on Newegg Commerce will help you shine a light on its historical performance.
What Are Growth Metrics Telling Us About The High P/E?
In order to justify its P/E ratio, Newegg Commerce would need to produce outstanding growth well in excess of the market.
Taking a look back first, we see that the company grew earnings per share by an impressive 18% last year. However, the latest three year period hasn't been as great in aggregate as it didn't manage to provide any growth at all. Therefore, it's fair to say that earnings growth has been inconsistent recently for the company.
Weighing that recent medium-term earnings trajectory against the broader market's one-year forecast for expansion of 9.4% shows it's noticeably less attractive on an annualised basis.
In light of this, it's alarming that Newegg Commerce's P/E sits above the majority of other companies. Apparently many investors in the company are way more bullish than recent times would indicate and aren't willing to let go of their stock at any price. Only the boldest would assume these prices are sustainable as a continuation of recent earnings trends is likely to weigh heavily on the share price eventually.
What We Can Learn From Newegg Commerce's P/E?
We'd say the price-to-earnings ratio's power isn't primarily as a valuation instrument but rather to gauge current investor sentiment and future expectations.
We've established that Newegg Commerce currently trades on a much higher than expected P/E since its recent three-year growth is lower than the wider market forecast. When we see weak earnings with slower than market growth, we suspect the share price is at risk of declining, sending the high P/E lower. If recent medium-term earnings trends continue, it will place shareholders' investments at significant risk and potential investors in danger of paying an excessive premium.
Having said that, be aware Newegg Commerce is showing 1 warning sign in our investment analysis, you should know about.
Of course, you might find a fantastic investment by looking at a few good candidates. So take a peek at this free list of companies with a strong growth track record, trading on a P/E below 20x.
Have feedback on this article? Concerned about the content? Get in touch with us directly. Alternatively, email editorial-team (at) simplywallst.com.
This article by Simply Wall St is general in nature. We provide commentary based on historical data and analyst forecasts only using an unbiased methodology and our articles are not intended to be financial advice. It does not constitute a recommendation to buy or sell any stock, and does not take account of your objectives, or your financial situation. We aim to bring you long-term focused analysis driven by fundamental data. Note that our analysis may not factor in the latest price-sensitive company announcements or qualitative material. Simply Wall St has no position in any stocks mentioned.
