
 Yahoo Finance
 Earnings Not Telling The Story For Schroders plc (LON:SDR)

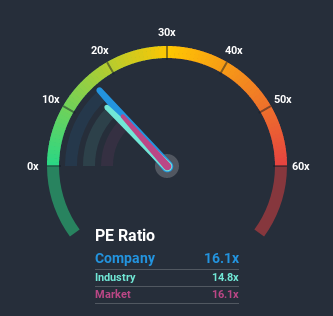
There wouldn't be many who think Schroders plc's (LON:SDR) price-to-earnings (or "P/E") ratio of 16.1x is worth a mention when the median P/E in the United Kingdom is similar at about 16x. While this might not raise any eyebrows, if the P/E ratio is not justified investors could be missing out on a potential opportunity or ignoring looming disappointment.
With only a limited decrease in earnings compared to most other companies of late, Schroders has been doing relatively well. One possibility is that the P/E is moderate because investors think this relatively better earnings performance might be about to evaporate. If you still like the company, you'd want its earnings trajectory to turn around before making any decisions. But at the very least, you'd be hoping the company doesn't fall back into the pack if your plan is to pick up some stock while it's not in favour.
Check out our latest analysis for Schroders
Keen to find out how analysts think Schroders' future stacks up against the industry? In that case, our free report is a great place to start.
How Is Schroders' Growth Trending?
In order to justify its P/E ratio, Schroders would need to produce growth that's similar to the market.
Taking a look back first, we see that there was hardly any earnings per share growth to speak of for the company over the past year. Whilst it's an improvement, it wasn't enough to get the company out of the hole it was in, with earnings down 14% overall from three years ago. Accordingly, shareholders would have felt downbeat about the medium-term rates of earnings growth.
Shifting to the future, estimates from the analysts covering the company suggest earnings should grow by 4.6% each year over the next three years. With the market predicted to deliver 15% growth per annum, the company is positioned for a weaker earnings result.
In light of this, it's curious that Schroders' P/E sits in line with the majority of other companies. Apparently many investors in the company are less bearish than analysts indicate and aren't willing to let go of their stock right now. These shareholders may be setting themselves up for future disappointment if the P/E falls to levels more in line with the growth outlook.
The Final Word
While the price-to-earnings ratio shouldn't be the defining factor in whether you buy a stock or not, it's quite a capable barometer of earnings expectations.
We've established that Schroders currently trades on a higher than expected P/E since its forecast growth is lower than the wider market. When we see a weak earnings outlook with slower than market growth, we suspect the share price is at risk of declining, sending the moderate P/E lower. This places shareholders' investments at risk and potential investors in danger of paying an unnecessary premium.
Don't forget that there may be other risks. For instance, we've identified 1 warning sign for Schroders that you should be aware of.
If P/E ratios interest you, you may wish to see this free collection of other companies that have grown earnings strongly and trade on P/E's below 20x.
This article by Simply Wall St is general in nature. It does not constitute a recommendation to buy or sell any stock, and does not take account of your objectives, or your financial situation. We aim to bring you long-term focused analysis driven by fundamental data. Note that our analysis may not factor in the latest price-sensitive company announcements or qualitative material. Simply Wall St has no position in any stocks mentioned.
Have feedback on this article? Concerned about the content? Get in touch with us directly. Alternatively, email editorial-team@simplywallst.com.
