
 Yahoo Finance
 Earnings Working Against AoFrio Limited's (NZSE:AOF) Share Price Following 29% Dive
AoFrio Limited (NZSE:AOF) shares have had a horrible month, losing 29% after a relatively good period beforehand. The recent drop completes a disastrous twelve months for shareholders, who are sitting on a 53% loss during that time.
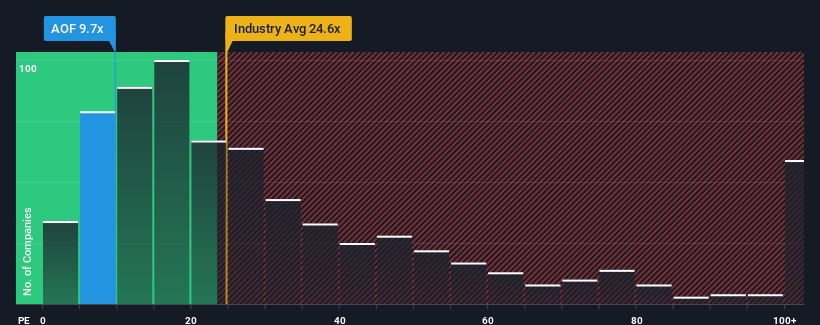
After such a large drop in price, given about half the companies in New Zealand have price-to-earnings ratios (or "P/E's") above 16x, you may consider AoFrio as an attractive investment with its 9.7x P/E ratio. Although, it's not wise to just take the P/E at face value as there may be an explanation why it's limited.
For example, consider that AoFrio's financial performance has been poor lately as its earnings have been in decline. It might be that many expect the disappointing earnings performance to continue or accelerate, which has repressed the P/E. If you like the company, you'd be hoping this isn't the case so that you could potentially pick up some stock while it's out of favour.
See our latest analysis for AoFrio
Although there are no analyst estimates available for AoFrio, take a look at this free data-rich visualisation to see how the company stacks up on earnings, revenue and cash flow.
What Are Growth Metrics Telling Us About The Low P/E?
In order to justify its P/E ratio, AoFrio would need to produce sluggish growth that's trailing the market.
If we review the last year of earnings, dishearteningly the company's profits fell to the tune of 17%. This has erased any of its gains during the last three years, with practically no change in EPS being achieved in total. So it appears to us that the company has had a mixed result in terms of growing earnings over that time.
Weighing that recent medium-term earnings trajectory against the broader market's one-year forecast for expansion of 8.8% shows it's noticeably less attractive on an annualised basis.
In light of this, it's understandable that AoFrio's P/E sits below the majority of other companies. It seems most investors are expecting to see the recent limited growth rates continue into the future and are only willing to pay a reduced amount for the stock.
The Final Word
AoFrio's recently weak share price has pulled its P/E below most other companies. It's argued the price-to-earnings ratio is an inferior measure of value within certain industries, but it can be a powerful business sentiment indicator.
We've established that AoFrio maintains its low P/E on the weakness of its recent three-year growth being lower than the wider market forecast, as expected. Right now shareholders are accepting the low P/E as they concede future earnings probably won't provide any pleasant surprises. Unless the recent medium-term conditions improve, they will continue to form a barrier for the share price around these levels.
Don't forget that there may be other risks. For instance, we've identified 3 warning signs for AoFrio (2 are potentially serious) you should be aware of.
If these risks are making you reconsider your opinion on AoFrio, explore our interactive list of high quality stocks to get an idea of what else is out there.
Have feedback on this article? Concerned about the content? Get in touch with us directly. Alternatively, email editorial-team (at) simplywallst.com.
This article by Simply Wall St is general in nature. We provide commentary based on historical data and analyst forecasts only using an unbiased methodology and our articles are not intended to be financial advice. It does not constitute a recommendation to buy or sell any stock, and does not take account of your objectives, or your financial situation. We aim to bring you long-term focused analysis driven by fundamental data. Note that our analysis may not factor in the latest price-sensitive company announcements or qualitative material. Simply Wall St has no position in any stocks mentioned.
