
 Yahoo Finance
 Ebusco Holding N.V.'s (AMS:EBUS) Earnings Haven't Escaped The Attention Of Investors
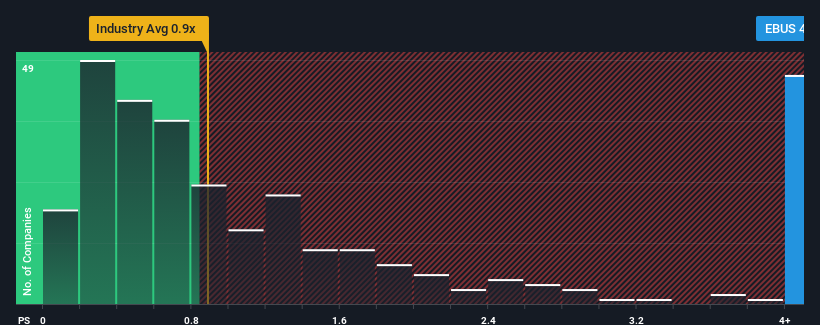
When you see that almost half of the companies in the Machinery industry in the Netherlands have price-to-sales ratios (or "P/S") below 0.9x, Ebusco Holding N.V. (AMS:EBUS) looks to be giving off strong sell signals with its 4.3x P/S ratio. Nonetheless, we'd need to dig a little deeper to determine if there is a rational basis for the highly elevated P/S.
Check out our latest analysis for Ebusco Holding
What Does Ebusco Holding's Recent Performance Look Like?
Recent times have been advantageous for Ebusco Holding as its revenues have been rising faster than most other companies. It seems that many are expecting the strong revenue performance to persist, which has raised the P/S. You'd really hope so, otherwise you're paying a pretty hefty price for no particular reason.
Want the full picture on analyst estimates for the company? Then our free report on Ebusco Holding will help you uncover what's on the horizon.
Do Revenue Forecasts Match The High P/S Ratio?
Ebusco Holding's P/S ratio would be typical for a company that's expected to deliver very strong growth, and importantly, perform much better than the industry.
Taking a look back first, we see that the company's revenues underwent some rampant growth over the last 12 months. The latest three year period has also seen an excellent 128% overall rise in revenue, aided by its incredible short-term performance. Accordingly, shareholders would have definitely welcomed those medium-term rates of revenue growth.
Shifting to the future, estimates from the four analysts covering the company suggest revenue should grow by 79% per annum over the next three years. With the industry only predicted to deliver 6.5% per annum, the company is positioned for a stronger revenue result.
With this information, we can see why Ebusco Holding is trading at such a high P/S compared to the industry. Apparently shareholders aren't keen to offload something that is potentially eyeing a more prosperous future.
The Final Word
While the price-to-sales ratio shouldn't be the defining factor in whether you buy a stock or not, it's quite a capable barometer of revenue expectations.
As we suspected, our examination of Ebusco Holding's analyst forecasts revealed that its superior revenue outlook is contributing to its high P/S. Right now shareholders are comfortable with the P/S as they are quite confident future revenues aren't under threat. Unless these conditions change, they will continue to provide strong support to the share price.
It is also worth noting that we have found 1 warning sign for Ebusco Holding that you need to take into consideration.
Of course, profitable companies with a history of great earnings growth are generally safer bets. So you may wish to see this free collection of other companies that have reasonable P/E ratios and have grown earnings strongly.
Have feedback on this article? Concerned about the content? Get in touch with us directly. Alternatively, email editorial-team (at) simplywallst.com.
This article by Simply Wall St is general in nature. We provide commentary based on historical data and analyst forecasts only using an unbiased methodology and our articles are not intended to be financial advice. It does not constitute a recommendation to buy or sell any stock, and does not take account of your objectives, or your financial situation. We aim to bring you long-term focused analysis driven by fundamental data. Note that our analysis may not factor in the latest price-sensitive company announcements or qualitative material. Simply Wall St has no position in any stocks mentioned.
Join A Paid User Research Session
You’ll receive a US$30 Amazon Gift card for 1 hour of your time while helping us build better investing tools for the individual investors like yourself. Sign up here
