
 Yahoo Finance
 Is Enprise Group Limited's (NZSE:ENS) Stock Price Struggling As A Result Of Its Mixed Financials?
With its stock down 16% over the past month, it is easy to disregard Enprise Group (NZSE:ENS). We, however decided to study the company's financials to determine if they have got anything to do with the price decline. Long-term fundamentals are usually what drive market outcomes, so it's worth paying close attention. In this article, we decided to focus on Enprise Group's ROE.
Return on Equity or ROE is a test of how effectively a company is growing its value and managing investors’ money. In other words, it is a profitability ratio which measures the rate of return on the capital provided by the company's shareholders.
Check out our latest analysis for Enprise Group
How Do You Calculate Return On Equity?
ROE can be calculated by using the formula:
Return on Equity = Net Profit (from continuing operations) ÷ Shareholders' Equity
So, based on the above formula, the ROE for Enprise Group is:
7.3% = NZ$1.0m ÷ NZ$14m (Based on the trailing twelve months to June 2020).
The 'return' is the amount earned after tax over the last twelve months. One way to conceptualize this is that for each NZ$1 of shareholders' capital it has, the company made NZ$0.07 in profit.
What Is The Relationship Between ROE And Earnings Growth?
We have already established that ROE serves as an efficient profit-generating gauge for a company's future earnings. We now need to evaluate how much profit the company reinvests or "retains" for future growth which then gives us an idea about the growth potential of the company. Assuming everything else remains unchanged, the higher the ROE and profit retention, the higher the growth rate of a company compared to companies that don't necessarily bear these characteristics.
Enprise Group's Earnings Growth And 7.3% ROE
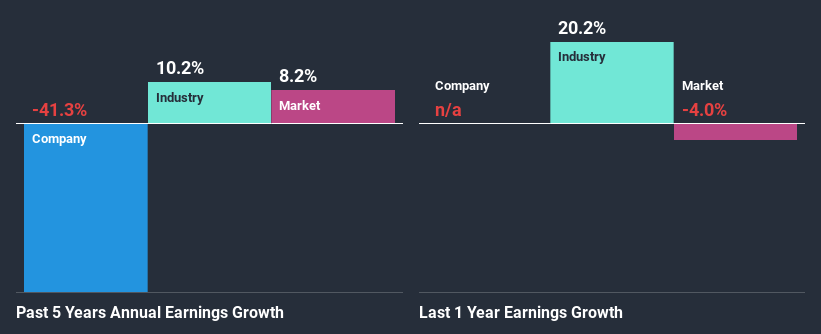
At first glance, Enprise Group's ROE doesn't look very promising. Next, when compared to the average industry ROE of 12%, the company's ROE leaves us feeling even less enthusiastic. For this reason, Enprise Group's five year net income decline of 41% is not surprising given its lower ROE. We reckon that there could also be other factors at play here. Such as - low earnings retention or poor allocation of capital.
From the 41% decline reported by the industry in the same period, we infer that Enprise Group and its industry are both shrinking at a similar rate.
Earnings growth is an important metric to consider when valuing a stock. The investor should try to establish if the expected growth or decline in earnings, whichever the case may be, is priced in. This then helps them determine if the stock is placed for a bright or bleak future. One good indicator of expected earnings growth is the P/E ratio which determines the price the market is willing to pay for a stock based on its earnings prospects. So, you may want to check if Enprise Group is trading on a high P/E or a low P/E, relative to its industry.
Is Enprise Group Efficiently Re-investing Its Profits?
Looking at its three-year median payout ratio of 33% (or a retention ratio of 67%) which is pretty normal, Enprise Group's declining earnings is rather baffling as one would expect to see a fair bit of growth when a company is retaining a good portion of its profits. So there might be other factors at play here which could potentially be hampering growth. For example, the business has faced some headwinds.
Moreover, Enprise Group has been paying dividends for four years, which is a considerable amount of time, suggesting that management must have perceived that the shareholders prefer consistent dividends even though earnings have been shrinking.
Summary
On the whole, we feel that the performance shown by Enprise Group can be open to many interpretations. While the company does have a high rate of reinvestment, the low ROE means that all that reinvestment is not reaping any benefit to its investors, and moreover, its having a negative impact on the earnings growth. Wrapping up, we would proceed with caution with this company and one way of doing that would be to look at the risk profile of the business. Our risks dashboard would have the 4 risks we have identified for Enprise Group.
This article by Simply Wall St is general in nature. It does not constitute a recommendation to buy or sell any stock, and does not take account of your objectives, or your financial situation. We aim to bring you long-term focused analysis driven by fundamental data. Note that our analysis may not factor in the latest price-sensitive company announcements or qualitative material. Simply Wall St has no position in any stocks mentioned.
Have feedback on this article? Concerned about the content? Get in touch with us directly. Alternatively, email editorial-team@simplywallst.com.
