
 Yahoo Finance
 Even after rising 14% this past week, Splitit Payments (ASX:SPT) shareholders are still down 69% over the past three years
It is a pleasure to report that the Splitit Payments Ltd (ASX:SPT) is up 46% in the last quarter. But that doesn't change the fact that the returns over the last three years have been disappointing. Tragically, the share price declined 69% in that time. Some might say the recent bounce is to be expected after such a bad drop. Perhaps the company has turned over a new leaf.
On a more encouraging note the company has added AU$13m to its market cap in just the last 7 days, so let's see if we can determine what's driven the three-year loss for shareholders.
Check out our latest analysis for Splitit Payments
Given that Splitit Payments didn't make a profit in the last twelve months, we'll focus on revenue growth to form a quick view of its business development. Shareholders of unprofitable companies usually expect strong revenue growth. That's because it's hard to be confident a company will be sustainable if revenue growth is negligible, and it never makes a profit.
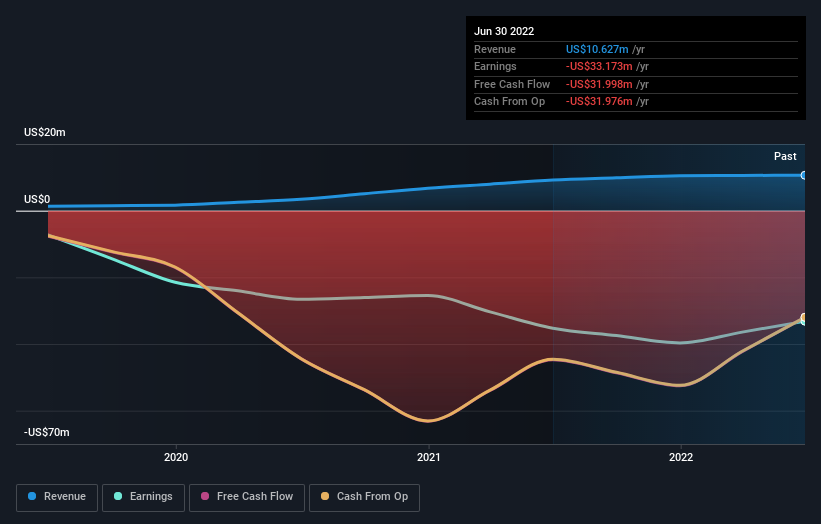
Over three years, Splitit Payments grew revenue at 61% per year. That is faster than most pre-profit companies. The share price has moved in quite the opposite direction, down 19% over that time, a bad result. This could mean hype has come out of the stock because the losses are concerning investors. But a share price drop of that magnitude could well signal that the market is overly negative on the stock.
You can see how earnings and revenue have changed over time in the image below (click on the chart to see the exact values).
You can see how its balance sheet has strengthened (or weakened) over time in this free interactive graphic.
A Different Perspective
The last twelve months weren't great for Splitit Payments shares, which cost holders 15%, while the market was up about 5.7%. However, keep in mind that even the best stocks will sometimes underperform the market over a twelve month period. Unfortunately, the longer term story isn't pretty, with investment losses running at 19% per year over three years. We would want clear information suggesting the company will grow, before taking the view that the share price will stabilize. I find it very interesting to look at share price over the long term as a proxy for business performance. But to truly gain insight, we need to consider other information, too. For example, we've discovered 5 warning signs for Splitit Payments (2 shouldn't be ignored!) that you should be aware of before investing here.
Of course Splitit Payments may not be the best stock to buy. So you may wish to see this free collection of growth stocks.
Please note, the market returns quoted in this article reflect the market weighted average returns of stocks that currently trade on AU exchanges.
Have feedback on this article? Concerned about the content? Get in touch with us directly. Alternatively, email editorial-team (at) simplywallst.com.
This article by Simply Wall St is general in nature. We provide commentary based on historical data and analyst forecasts only using an unbiased methodology and our articles are not intended to be financial advice. It does not constitute a recommendation to buy or sell any stock, and does not take account of your objectives, or your financial situation. We aim to bring you long-term focused analysis driven by fundamental data. Note that our analysis may not factor in the latest price-sensitive company announcements or qualitative material. Simply Wall St has no position in any stocks mentioned.
Join A Paid User Research Session
You’ll receive a US$30 Amazon Gift card for 1 hour of your time while helping us build better investing tools for the individual investors like yourself. Sign up here
