
 Yahoo Finance
 Is ExlService Holdings Inc (NASDAQ:EXLS) A Financially Strong Company?

Small-caps and large-caps are wildly popular among investors, however, mid-cap stocks, such as ExlService Holdings Inc (NASDAQ:EXLS), with a market capitalization of US$2.11b, rarely draw their attention from the investing community. Despite this, the two other categories have lagged behind the risk-adjusted returns of commonly ignored mid-cap stocks. This article will examine EXLS’s financial liquidity and debt levels to get an idea of whether the company can deal with cyclical downturns and maintain funds to accommodate strategic spending for future growth. Don’t forget that this is a general and concentrated examination of ExlService Holdings’s financial health, so you should conduct further analysis into EXLS here.
Check out our latest analysis for ExlService Holdings
Does EXLS produce enough cash relative to debt?
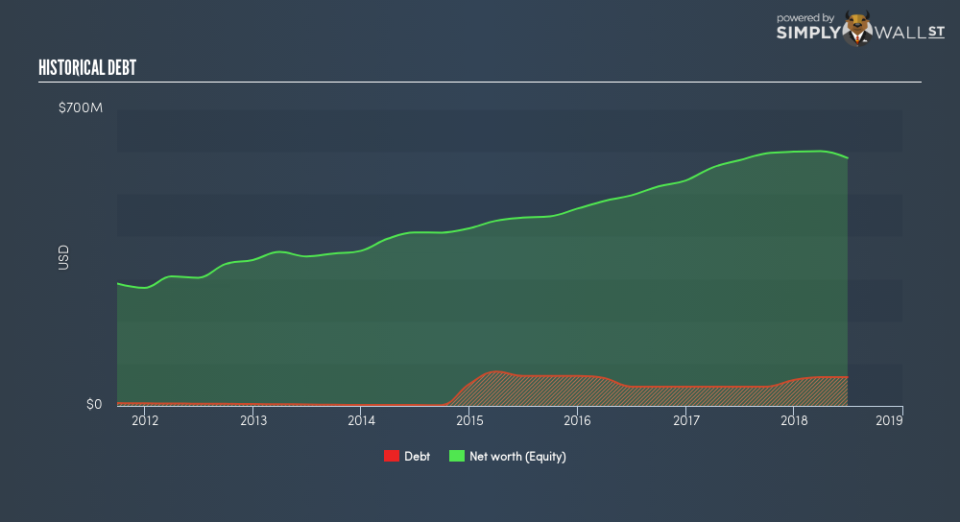
Over the past year, EXLS has ramped up its debt from US$45.5m to US$68.1m , which comprises of short- and long-term debt. With this increase in debt, the current cash and short-term investment levels stands at US$233.1m for investing into the business. On top of this, EXLS has produced cash from operations of US$81.9m during the same period of time, leading to an operating cash to total debt ratio of 120%, indicating that EXLS’s current level of operating cash is high enough to cover debt. This ratio can also be a sign of operational efficiency as an alternative to return on assets. In EXLS’s case, it is able to generate 1.2x cash from its debt capital.
Can EXLS meet its short-term obligations with the cash in hand?
Looking at EXLS’s most recent US$119.6m liabilities, it seems that the business has been able to meet these obligations given the level of current assets of US$426.7m, with a current ratio of 3.57x. However, anything above 3x is considered high and could mean that EXLS has too much idle capital in low-earning investments.
Is EXLS’s debt level acceptable?
EXLS’s level of debt is appropriate relative to its total equity, at 11.6%. This range is considered safe as EXLS is not taking on too much debt obligation, which can be restrictive and risky for equity-holders. We can check to see whether EXLS is able to meet its debt obligations by looking at the net interest coverage ratio. A company generating earnings before interest and tax (EBIT) at least three times its net interest payments is considered financially sound. In EXLS’s, case, the ratio of 74.49x suggests that interest is comfortably covered, which means that lenders may be inclined to lend more money to the company, as it is seen as safe in terms of payback.
Next Steps:
EXLS’s high cash coverage and low debt levels indicate its ability to utilise its borrowings efficiently in order to generate ample cash flow. In addition to this, the company exhibits proper management of current assets and upcoming liabilities. I admit this is a fairly basic analysis for EXLS’s financial health. Other important fundamentals need to be considered alongside. I suggest you continue to research ExlService Holdings to get a more holistic view of the stock by looking at:
Future Outlook: What are well-informed industry analysts predicting for EXLS’s future growth? Take a look at our free research report of analyst consensus for EXLS’s outlook.
Valuation: What is EXLS worth today? Is the stock undervalued, even when its growth outlook is factored into its intrinsic value? The intrinsic value infographic in our free research report helps visualize whether EXLS is currently mispriced by the market.
Other High-Performing Stocks: Are there other stocks that provide better prospects with proven track records? Explore our free list of these great stocks here.
To help readers see past the short term volatility of the financial market, we aim to bring you a long-term focused research analysis purely driven by fundamental data. Note that our analysis does not factor in the latest price-sensitive company announcements.
The author is an independent contributor and at the time of publication had no position in the stocks mentioned. For errors that warrant correction please contact the editor at editorial-team@simplywallst.com.
