
 Yahoo Finance
 F.N.B (NYSE:FNB) investors are sitting on a loss of 4.9% if they invested five years ago
In order to justify the effort of selecting individual stocks, it's worth striving to beat the returns from a market index fund. But in any portfolio, there will be mixed results between individual stocks. So we wouldn't blame long term F.N.B. Corporation (NYSE:FNB) shareholders for doubting their decision to hold, with the stock down 23% over a half decade. Furthermore, it's down 13% in about a quarter. That's not much fun for holders. But this could be related to the weak market, which is down 18% in the same period.
Since shareholders are down over the longer term, lets look at the underlying fundamentals over the that time and see if they've been consistent with returns.
See our latest analysis for F.N.B
There is no denying that markets are sometimes efficient, but prices do not always reflect underlying business performance. One way to examine how market sentiment has changed over time is to look at the interaction between a company's share price and its earnings per share (EPS).
While the share price declined over five years, F.N.B actually managed to increase EPS by an average of 6.7% per year. Given the share price reaction, one might suspect that EPS is not a good guide to the business performance during the period (perhaps due to a one-off loss or gain). Alternatively, growth expectations may have been unreasonable in the past.
Due to the lack of correlation between the EPS growth and the falling share price, it's worth taking a look at other metrics to try to understand the share price movement.
The steady dividend doesn't really explain why the share price is down. It's not immediately clear to us why the stock price is down but further research might provide some answers.
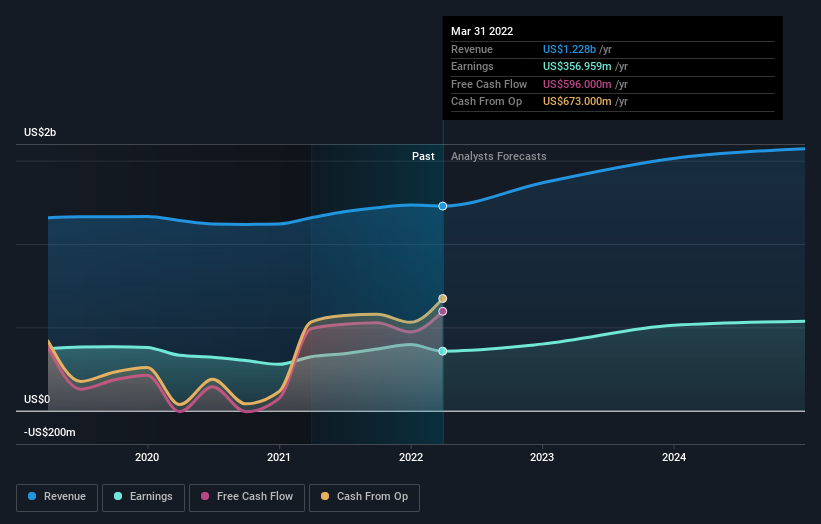
You can see below how earnings and revenue have changed over time (discover the exact values by clicking on the image).
We like that insiders have been buying shares in the last twelve months. Having said that, most people consider earnings and revenue growth trends to be a more meaningful guide to the business. This free report showing analyst forecasts should help you form a view on F.N.B
What About Dividends?
As well as measuring the share price return, investors should also consider the total shareholder return (TSR). The TSR is a return calculation that accounts for the value of cash dividends (assuming that any dividend received was reinvested) and the calculated value of any discounted capital raisings and spin-offs. So for companies that pay a generous dividend, the TSR is often a lot higher than the share price return. In the case of F.N.B, it has a TSR of -4.9% for the last 5 years. That exceeds its share price return that we previously mentioned. The dividends paid by the company have thusly boosted the total shareholder return.
A Different Perspective
While it's certainly disappointing to see that F.N.B shares lost 6.3% throughout the year, that wasn't as bad as the market loss of 19%. Unfortunately, last year's performance may indicate unresolved challenges, given that it's worse than the annualised loss of 1.0% over the last half decade. While some investors do well specializing in buying companies that are struggling (but nonetheless undervalued), don't forget that Buffett said that 'turnarounds seldom turn'. I find it very interesting to look at share price over the long term as a proxy for business performance. But to truly gain insight, we need to consider other information, too. Take risks, for example - F.N.B has 1 warning sign we think you should be aware of.
F.N.B is not the only stock that insiders are buying. For those who like to find winning investments this free list of growing companies with recent insider purchasing, could be just the ticket.
Please note, the market returns quoted in this article reflect the market weighted average returns of stocks that currently trade on US exchanges.
Have feedback on this article? Concerned about the content? Get in touch with us directly. Alternatively, email editorial-team (at) simplywallst.com.
This article by Simply Wall St is general in nature. We provide commentary based on historical data and analyst forecasts only using an unbiased methodology and our articles are not intended to be financial advice. It does not constitute a recommendation to buy or sell any stock, and does not take account of your objectives, or your financial situation. We aim to bring you long-term focused analysis driven by fundamental data. Note that our analysis may not factor in the latest price-sensitive company announcements or qualitative material. Simply Wall St has no position in any stocks mentioned.
