
 Yahoo Finance
 How Financially Strong Is Summerset Group Holdings Limited (NZSE:SUM)?

Want to participate in a short research study? Help shape the future of investing tools and receive a $20 prize!
Investors are always looking for growth in small-cap stocks like Summerset Group Holdings Limited (NZSE:SUM), with a market cap of NZ$1.4b. However, an important fact which most ignore is: how financially healthy is the business? Companies operating in the Healthcare industry, even ones that are profitable, are more likely to be higher risk. Evaluating financial health as part of your investment thesis is essential. I believe these basic checks tell most of the story you need to know. Nevertheless, given that I have not delve into the company-specifics, I’d encourage you to dig deeper yourself into SUM here.
How much cash does SUM generate through its operations?
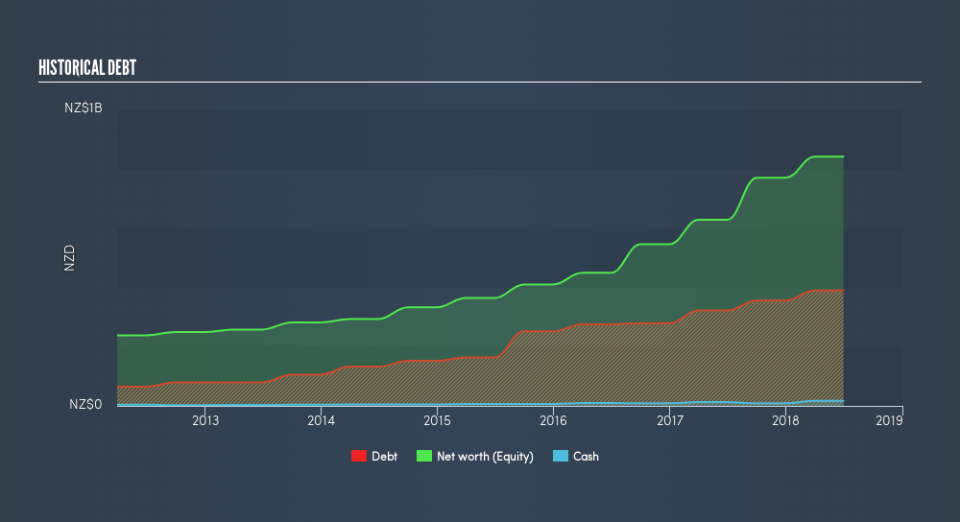
SUM’s debt levels surged from NZ$322m to NZ$389m over the last 12 months , which accounts for long term debt. With this increase in debt, SUM currently has NZ$17m remaining in cash and short-term investments for investing into the business. Moreover, SUM has produced NZ$214m in operating cash flow during the same period of time, resulting in an operating cash to total debt ratio of 55%, meaning that SUM’s debt is appropriately covered by operating cash. This ratio can also be a sign of operational efficiency as an alternative to return on assets. In SUM’s case, it is able to generate 0.55x cash from its debt capital.
Does SUM’s liquid assets cover its short-term commitments?
With current liabilities at NZ$76m, it appears that the company may not be able to easily meet these obligations given the level of current assets of NZ$44m, with a current ratio of 0.58x.
Does SUM face the risk of succumbing to its debt-load?
With a debt-to-equity ratio of 46%, SUM can be considered as an above-average leveraged company. This is not uncommon for a small-cap company given that debt tends to be lower-cost and at times, more accessible. We can test if SUM’s debt levels are sustainable by measuring interest payments against earnings of a company. Ideally, earnings before interest and tax (EBIT) should cover net interest by at least three times. For SUM, the ratio of 1.78x suggests that interest is not strongly covered, which means that lenders may refuse to lend the company more money, as it is seen as too risky in terms of default.
Next Steps:
SUM’s high cash coverage means that, although its debt levels are high, the company is able to utilise its borrowings efficiently in order to generate cash flow. However, its low liquidity raises concerns over whether current asset management practices are properly implemented for the small-cap. This is only a rough assessment of financial health, and I’m sure SUM has company-specific issues impacting its capital structure decisions. I recommend you continue to research Summerset Group Holdings to get a better picture of the stock by looking at:
Future Outlook: What are well-informed industry analysts predicting for SUM’s future growth? Take a look at our free research report of analyst consensus for SUM’s outlook.
Historical Performance: What has SUM’s returns been like over the past? Go into more detail in the past track record analysis and take a look at the free visual representations of our analysis for more clarity.
Other High-Performing Stocks: Are there other stocks that provide better prospects with proven track records? Explore our free list of these great stocks here.
We aim to bring you long-term focused research analysis driven by fundamental data. Note that our analysis may not factor in the latest price-sensitive company announcements or qualitative material.
If you spot an error that warrants correction, please contact the editor at editorial-team@simplywallst.com. This article by Simply Wall St is general in nature. It does not constitute a recommendation to buy or sell any stock, and does not take account of your objectives, or your financial situation. Simply Wall St has no position in the stocks mentioned. Thank you for reading.
