
 Yahoo Finance
 Is FleetCor Technologies Inc’s (NYSE:FLT) Balance Sheet Strong Enough To Weather A Storm?

The size of FleetCor Technologies Inc (NYSE:FLT), a US$19.73b large-cap, often attracts investors seeking a reliable investment in the stock market. Doing business globally, large caps tend to have diversified revenue streams and attractive capital returns, making them desirable investments for risk-averse portfolios. But, the key to extending previous success is in the health of the company’s financials. I will provide an overview of FleetCor Technologies’s financial liquidity and leverage to give you an idea of FleetCor Technologies’s position to take advantage of potential acquisitions or comfortably endure future downturns. Note that this commentary is very high-level and solely focused on financial health, so I suggest you dig deeper yourself into FLT here. Check out our latest analysis for FleetCor Technologies
How much cash does FLT generate through its operations?
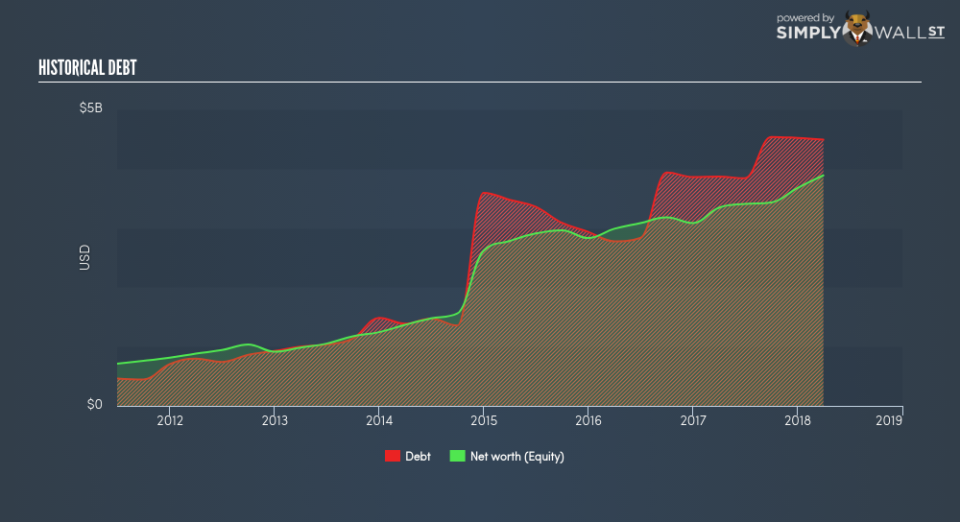
Over the past year, FLT has ramped up its debt from US$3.86b to US$4.52b , which is made up of current and long term debt. With this increase in debt, FLT’s cash and short-term investments stands at US$913.60m , ready to deploy into the business. On top of this, FLT has produced US$675.72m in operating cash flow during the same period of time, resulting in an operating cash to total debt ratio of 14.95%, indicating that FLT’s operating cash is not sufficient to cover its debt. This ratio can also be a sign of operational efficiency as an alternative to return on assets. In FLT’s case, it is able to generate 0.15x cash from its debt capital.
Can FLT pay its short-term liabilities?
At the current liabilities level of US$4.10b liabilities, it appears that the company is not able to meet these obligations given the level of current assets of US$3.55b, with a current ratio of 0.87x below the prudent level of 3x.
Does FLT face the risk of succumbing to its debt-load?
With total debt exceeding equities, FleetCor Technologies is considered a highly levered company. This is not unusual for large-caps since debt tends to be less expensive than equity because interest payments are tax deductible. Accordingly, large companies often have an advantage over small-caps through lower cost of capital due to cheaper financing. We can test if FLT’s debt levels are sustainable by measuring interest payments against earnings of a company. As a rule of thumb, a company should have earnings before interest and tax (EBIT) of at least three times the size of net interest. In FLT’s case, the ratio of 8.24x suggests that interest is appropriately covered. Large-cap investments like FLT are often believed to be a safe investment due to their ability to pump out ample earnings multiple times its interest payments.
Next Steps:
FLT’s high debt levels is not met with high cash flow coverage. This leaves room for improvement in terms of debt management and operational efficiency. In addition to this, its lack of liquidity raises questions over current asset management practices for the large-cap. I admit this is a fairly basic analysis for FLT’s financial health. Other important fundamentals need to be considered alongside. You should continue to research FleetCor Technologies to get a more holistic view of the stock by looking at:
Future Outlook: What are well-informed industry analysts predicting for FLT’s future growth? Take a look at our free research report of analyst consensus for FLT’s outlook.
Valuation: What is FLT worth today? Is the stock undervalued, even when its growth outlook is factored into its intrinsic value? The intrinsic value infographic in our free research report helps visualize whether FLT is currently mispriced by the market.
Other High-Performing Stocks: Are there other stocks that provide better prospects with proven track records? Explore our free list of these great stocks here.
To help readers see pass the short term volatility of the financial market, we aim to bring you a long-term focused research analysis purely driven by fundamental data. Note that our analysis does not factor in the latest price sensitive company announcements.
The author is an independent contributor and at the time of publication had no position in the stocks mentioned.
