
 Yahoo Finance
 Is FuelCell Energy, Inc. (NASDAQ:FCEL) A Financially Sound Company?

FuelCell Energy, Inc. (NASDAQ:FCEL) is a small-cap stock with a market capitalization of US$58m. While investors primarily focus on the growth potential and competitive landscape of the small-cap companies, they end up ignoring a key aspect, which could be the biggest threat to its existence: its financial health. Why is it important? Given that FCEL is not presently profitable, it’s essential to assess the current state of its operations and pathway to profitability. Here are few basic financial health checks you should consider before taking the plunge. However, I know these factors are very high-level, so I recommend you dig deeper yourself into FCEL here.
Does FCEL produce enough cash relative to debt?
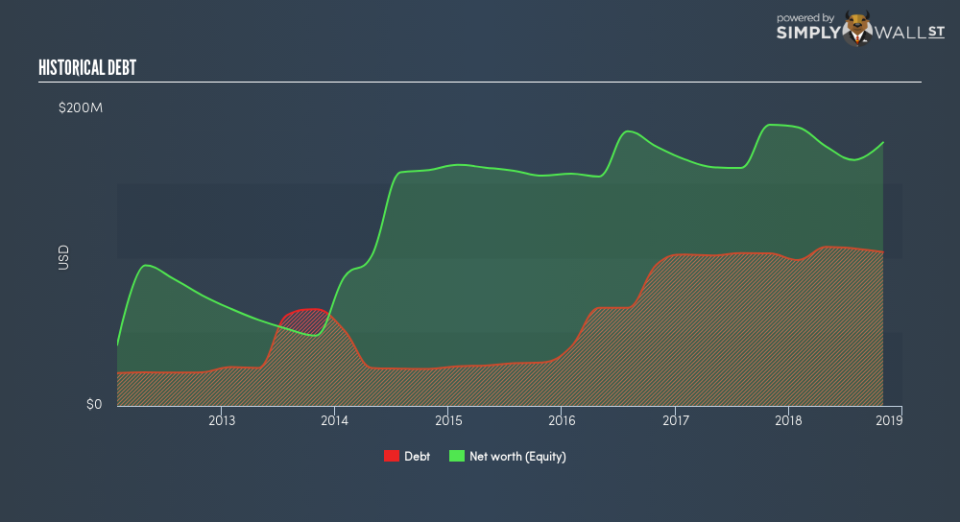
FCEL’s debt level has been constant at around US$104m over the previous year – this includes long-term debt. At this current level of debt, FCEL’s cash and short-term investments stands at US$39m for investing into the business. Moreover, FCEL has produced cash from operations of US$16m over the same time period, leading to an operating cash to total debt ratio of 16%, indicating that FCEL’s current level of operating cash is not high enough to cover debt. This ratio can also be interpreted as a measure of efficiency for loss making businesses since metrics such as return on asset (ROA) requires a positive net income. In FCEL’s case, it is able to generate 0.16x cash from its debt capital.
Does FCEL’s liquid assets cover its short-term commitments?
With current liabilities at US$60m, the company has maintained a safe level of current assets to meet its obligations, with the current ratio last standing at 2.17x. For Electrical companies, this ratio is within a sensible range since there’s a sufficient cash cushion without leaving too much capital idle or in low-earning investments.
Does FCEL face the risk of succumbing to its debt-load?
FCEL is a relatively highly levered company with a debt-to-equity of 58%. This is not unusual for small-caps as debt tends to be a cheaper and faster source of funding for some businesses. Though, since FCEL is currently loss-making, sustainability of its current state of operations becomes a concern. Running high debt, while not yet making money, can be risky in unexpected downturns as liquidity may dry up, making it hard to operate.
Next Steps:
Although FCEL’s debt level is towards the higher end of the spectrum, its cash flow coverage seems adequate to meet obligations which means its debt is being efficiently utilised. Since there is also no concerns around FCEL’s liquidity needs, this may be its optimal capital structure for the time being. Keep in mind I haven’t considered other factors such as how FCEL has been performing in the past. You should continue to research FuelCell Energy to get a more holistic view of the small-cap by looking at:
Future Outlook: What are well-informed industry analysts predicting for FCEL’s future growth? Take a look at our free research report of analyst consensus for FCEL’s outlook.
Historical Performance: What has FCEL’s returns been like over the past? Go into more detail in the past track record analysis and take a look at the free visual representations of our analysis for more clarity.
Other High-Performing Stocks: Are there other stocks that provide better prospects with proven track records? Explore our free list of these great stocks here.
To help readers see past the short term volatility of the financial market, we aim to bring you a long-term focused research analysis purely driven by fundamental data. Note that our analysis does not factor in the latest price-sensitive company announcements.
The author is an independent contributor and at the time of publication had no position in the stocks mentioned. For errors that warrant correction please contact the editor at editorial-team@simplywallst.com.
