
 Yahoo Finance
 Further weakness as Global Blue Group Holding (NYSE:GB) drops 4.6% this week, taking one-year losses to 47%
Passive investing in an index fund is a good way to ensure your own returns roughly match the overall market. Active investors aim to buy stocks that vastly outperform the market - but in the process, they risk under-performance. Unfortunately the Global Blue Group Holding AG (NYSE:GB) share price slid 47% over twelve months. That falls noticeably short of the market return of around 3.3%. We note that it has not been easy for shareholders over three years, either; the share price is down 34% in that time. Shareholders have had an even rougher run lately, with the share price down 19% in the last 90 days.
If the past week is anything to go by, investor sentiment for Global Blue Group Holding isn't positive, so let's see if there's a mismatch between fundamentals and the share price.
Check out our latest analysis for Global Blue Group Holding
Global Blue Group Holding isn't currently profitable, so most analysts would look to revenue growth to get an idea of how fast the underlying business is growing. When a company doesn't make profits, we'd generally expect to see good revenue growth. That's because fast revenue growth can be easily extrapolated to forecast profits, often of considerable size.
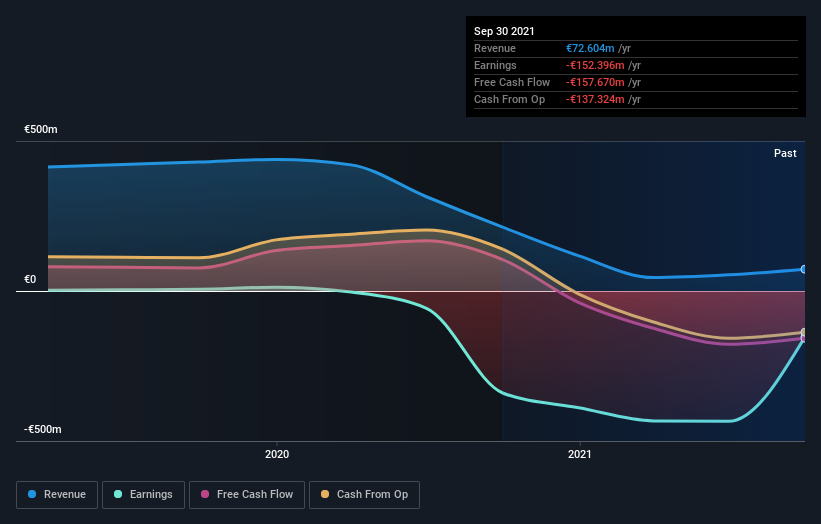
Global Blue Group Holding's revenue didn't grow at all in the last year. In fact, it fell 66%. If you think that's a particularly bad result, you're statistically on the money Meanwhile, the share price dropped by 47%. It's always work digging deeper, but we'd probably need to see a strong balance sheet and bottom line improvements to get interested in this one.
You can see how earnings and revenue have changed over time in the image below (click on the chart to see the exact values).
You can see how its balance sheet has strengthened (or weakened) over time in this free interactive graphic.
A Different Perspective
Global Blue Group Holding shareholders are down 47% for the year, but the broader market is up 3.3%. Of course the long term matters more than the short term, and even great stocks will sometimes have a poor year. Shareholders have lost 10% per year over the last three years, so the share price drop has become steeper, over the last year; a potential symptom of as yet unsolved challenges. We would be wary of buying into a company with unsolved problems, although some investors will buy into struggling stocks if they believe the price is sufficiently attractive. It's always interesting to track share price performance over the longer term. But to understand Global Blue Group Holding better, we need to consider many other factors. For instance, we've identified 4 warning signs for Global Blue Group Holding (3 are potentially serious) that you should be aware of.
We will like Global Blue Group Holding better if we see some big insider buys. While we wait, check out this free list of growing companies with considerable, recent, insider buying.
Please note, the market returns quoted in this article reflect the market weighted average returns of stocks that currently trade on US exchanges.
Have feedback on this article? Concerned about the content? Get in touch with us directly. Alternatively, email editorial-team (at) simplywallst.com.
This article by Simply Wall St is general in nature. We provide commentary based on historical data and analyst forecasts only using an unbiased methodology and our articles are not intended to be financial advice. It does not constitute a recommendation to buy or sell any stock, and does not take account of your objectives, or your financial situation. We aim to bring you long-term focused analysis driven by fundamental data. Note that our analysis may not factor in the latest price-sensitive company announcements or qualitative material. Simply Wall St has no position in any stocks mentioned.
