
 Yahoo Finance
 GBP/USD Technical Analysis: Rally Capped Below 1.55 Figure
DailyFX.com -
To receive Ilya's analysis directly via email, please SIGN UP HERE
Talking Points:
GBP/USD Technical Strategy: Long at 1.5373
Support: 1.5322, 1.5194, 1.4950
Resistance: 1.5551, 1.5737, 1.5923
The British Pound paused to digest gains once again having fallen short of overcoming the 1.55 figure against the US Dollar. A daily close above the 38.2% Fibonacci retracement at 1.5551 exposes the 50% level at 1.5737. Alternatively, a reversal below the 23.6% Fib at 1.5322 clears the way for a test of 1.5194, the intersection of channel top resistance-turned-support and a horizontal pivot.
We bought GBPUSD at 1.5373, initially aiming for 1.5551. A stop-loss will be activated on a daily close below 1.5194. We will take profit on half of the position and move the stop to breakeven once the first target is reached.
Add these technical levels directly to your charts with our Support/Resistance Wizard app!
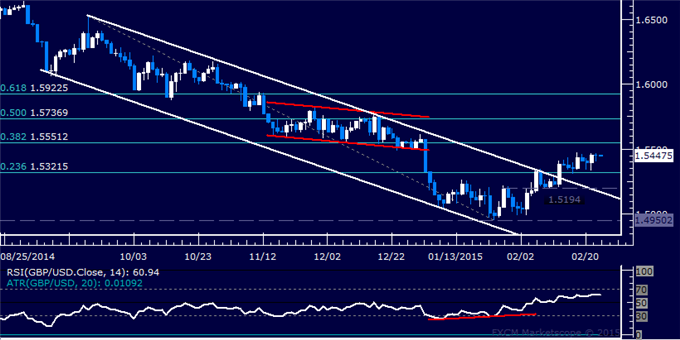
Daily Chart - Created Using FXCM Marketscope
--- Written by Ilya Spivak, Currency Strategist for DailyFX.com
DailyFX provides forex news and technical analysis on the trends that influence the global currency markets.
Learn forex trading with a free practice account and trading charts from FXCM.
