
 Yahoo Finance
 Globe Life's (NYSE:GL) investors will be pleased with their respectable 48% return over the last three years
It hasn't been the best quarter for Globe Life Inc. (NYSE:GL) shareholders, since the share price has fallen 11% in that time. In contrast the stock has done reasonably well over three years. In fact the stock is up 44%, which is better than the market return of 44%.
So let's investigate and see if the longer term performance of the company has been in line with the underlying business' progress.
View our latest analysis for Globe Life
There is no denying that markets are sometimes efficient, but prices do not always reflect underlying business performance. By comparing earnings per share (EPS) and share price changes over time, we can get a feel for how investor attitudes to a company have morphed over time.
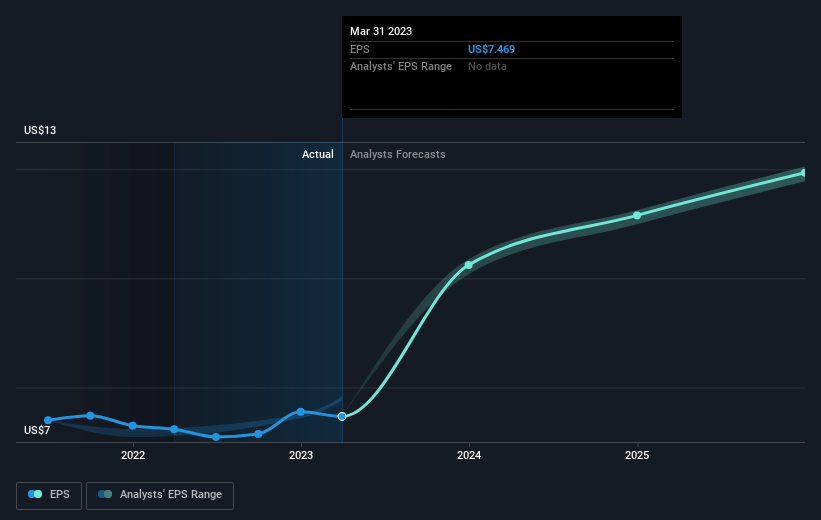
Globe Life was able to grow its EPS at 3.2% per year over three years, sending the share price higher. In comparison, the 13% per year gain in the share price outpaces the EPS growth. So it's fair to assume the market has a higher opinion of the business than it did three years ago. It is quite common to see investors become enamoured with a business, after a few years of solid progress.
The image below shows how EPS has tracked over time (if you click on the image you can see greater detail).
It's probably worth noting that the CEO is paid less than the median at similar sized companies. It's always worth keeping an eye on CEO pay, but a more important question is whether the company will grow earnings throughout the years. Dive deeper into the earnings by checking this interactive graph of Globe Life's earnings, revenue and cash flow.
What About Dividends?
As well as measuring the share price return, investors should also consider the total shareholder return (TSR). Whereas the share price return only reflects the change in the share price, the TSR includes the value of dividends (assuming they were reinvested) and the benefit of any discounted capital raising or spin-off. Arguably, the TSR gives a more comprehensive picture of the return generated by a stock. We note that for Globe Life the TSR over the last 3 years was 48%, which is better than the share price return mentioned above. And there's no prize for guessing that the dividend payments largely explain the divergence!
A Different Perspective
It's nice to see that Globe Life shareholders have received a total shareholder return of 11% over the last year. That's including the dividend. That's better than the annualised return of 6% over half a decade, implying that the company is doing better recently. Given the share price momentum remains strong, it might be worth taking a closer look at the stock, lest you miss an opportunity. While it is well worth considering the different impacts that market conditions can have on the share price, there are other factors that are even more important. Take risks, for example - Globe Life has 1 warning sign we think you should be aware of.
Of course, you might find a fantastic investment by looking elsewhere. So take a peek at this free list of companies we expect will grow earnings.
Please note, the market returns quoted in this article reflect the market weighted average returns of stocks that currently trade on American exchanges.
Have feedback on this article? Concerned about the content? Get in touch with us directly. Alternatively, email editorial-team (at) simplywallst.com.
This article by Simply Wall St is general in nature. We provide commentary based on historical data and analyst forecasts only using an unbiased methodology and our articles are not intended to be financial advice. It does not constitute a recommendation to buy or sell any stock, and does not take account of your objectives, or your financial situation. We aim to bring you long-term focused analysis driven by fundamental data. Note that our analysis may not factor in the latest price-sensitive company announcements or qualitative material. Simply Wall St has no position in any stocks mentioned.
Join A Paid User Research Session
You’ll receive a US$30 Amazon Gift card for 1 hour of your time while helping us build better investing tools for the individual investors like yourself. Sign up here
