
 Yahoo Finance
 Gold Chart Setup Warns of Reversal, SPX 500 Snaps 3-Day Win Streak
DailyFX.com -
Talking Points:
US Dollar Continues to Rise, Establishes New 5-Year High
S&P 500 Stalls at Record High, Snaps Three-Day Win Streak
Crude Oil Struggling for Follow-Through, Gold Vulnerable
Can’t access the Dow Jones FXCM US Dollar Index? Try the USD basket on Mirror Trader. **
US DOLLAR TECHNICAL ANALYSIS – Prices continue to push higher, advancing to set a new five-year high. A daily close above the 38.2% Fibonacci expansion at 11374 exposes the 50% level at 11422. Alternatively, a reversal below the 23.6% Fib at 11315 clears the way for a test of the 14.6% expansion at 11278.
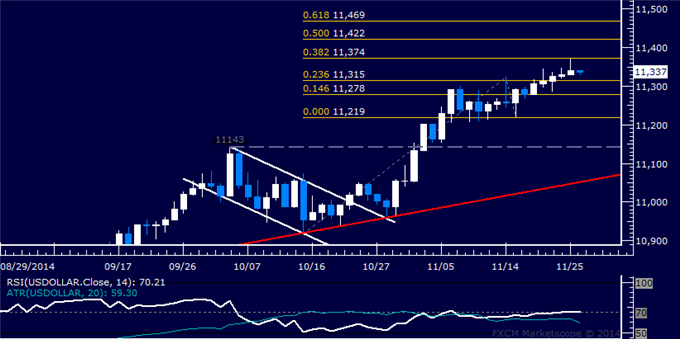
Daily Chart - Created Using FXCM Marketscope 2.0
** The Dow Jones FXCM US Dollar Index and the Mirror Trader USD basket are not the same product.
S&P 500 TECHNICAL ANALYSIS – Prices stalled after setting yet another record high, snapping a three-day winning streak. A daily close above the 38.2% Fibonacci expansion at 2081.20 exposes the 50% level at 2105.60. Alternatively, a move below the 23.6% Fib at 2051.00 targets the 2022.10-32 areamarked by the 14.6% expansion and the September 19 high.
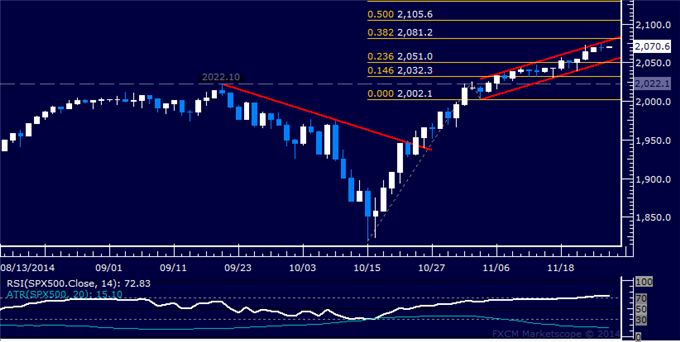
Daily Chart - Created Using FXCM Marketscope 2.0
GOLD TECHNICAL ANALYSIS – Prices are carving out a bearish Rising Wedge chart formation, hinting a move lower may be ahead. A daily close below the pattern’s floor at 1196.21 exposes the 1178.86-80.84 area (December 2013 low, 23.6% Fibonacci retracement). Alternatively, a push above the intersection of the wedge top and the 38.2% level at 1212.23 targets a falling trend line set from early June, now at 1224.37.
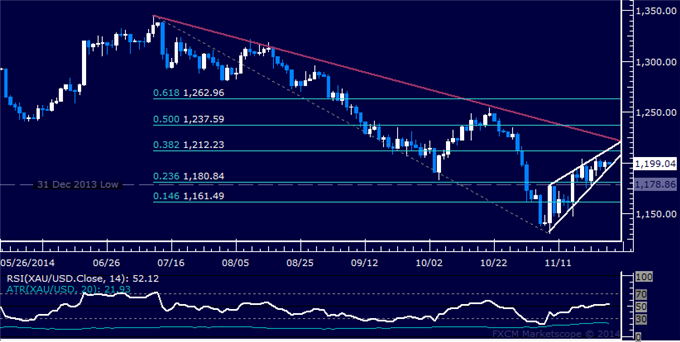
Daily Chart - Created Using FXCM Marketscope 2.0
CRUDE OIL TECHNICAL ANALYSIS – Prices are struggling with follow-through having attempted a recovery as expected following the appearance of a bullish Piercing Line candlestick pattern. A daily close below rising trend line support at 78.38 exposes the November 14 low at 76.74. Alternatively, a reversal above falling trend line resistance at 80.50 targets the 14.6% Fibonacci retracement at 82.43.
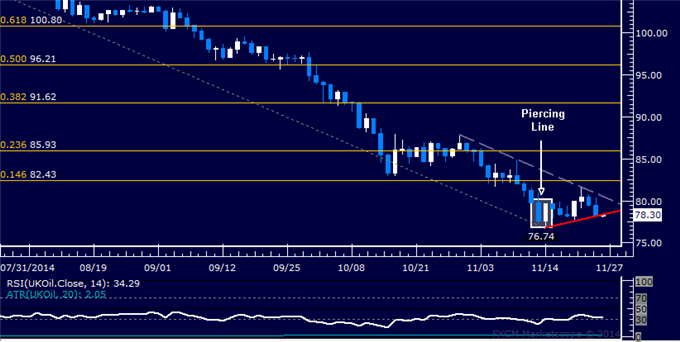
Daily Chart - Created Using FXCM Marketscope 2.0
--- Written by Ilya Spivak, Currency Strategist for DailyFX.com
To receive Ilya's analysis directly via email, please SIGN UP HERE
Contact and follow Ilya on Twitter: @IlyaSpivak
DailyFX provides forex news and technical analysis on the trends that influence the global currency markets.
Learn forex trading with a free practice account and trading charts from FXCM.
