
 Yahoo Finance
 Gold Price Futures (GC) Technical Analysis – September 14, 2017 Forecast
December Comex Gold futures are driving lower shortly before the release of the latest U.S. consumer inflation data at 1230 GMT. Traders are looking for monthly CPI to rise 0.3% and monthly Core CPI to come in at 0.2%. Stronger than expected numbers should put pressure on gold prices.
An increase in consumer inflation will trigger a rise in U.S. Treasury yields which will help boost the U.S. Dollar, making it a more attractive asset. However, it will not mean the Fed will raise rates this year. The only thing a strong number will do is scare the short-sellers out of the U.S. Dollar.
Weakening U.S. stock prices could slow down the selling in gold.
Technical Analysis
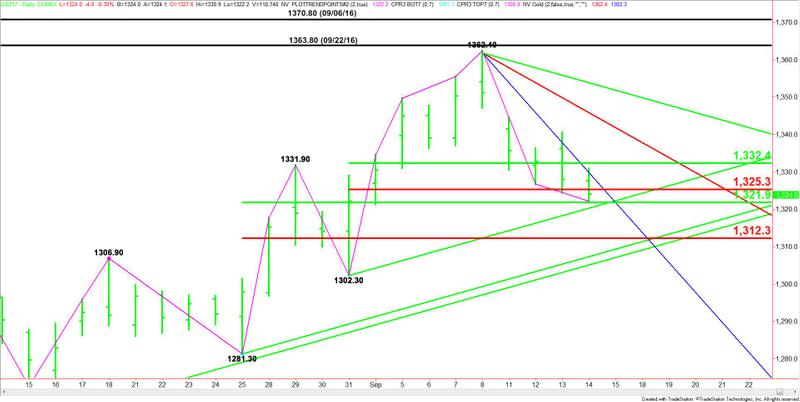
The main trend is up according to the daily swing chart. A trade through $1302.30 will change the main trend to down with the next main target $1281.30.
A move through $1362.40 will signal a resumption of the uptrend with potential targets at $1363.80 and $1370.80.
The short-term range is 1302.30 to 1362.40. Its retracement zone is $1332.40 to $1325.30.
The main range is $1281.30 to $1362.40. Its retracement zone is $1321.90 to $1312.30.
Forecast
Based on the current price at $1324.00, the market is trading inside a price cluster formed by a retracement zone inside a triangle.
I’m looking for a possible two-sided trade if gold remains inside the triangle, bounded by $1330.40 and $1320.30, so basically a $10.00 range.
A sustained move over $1330.40 will be a sign of strength. Crossing over to the 50% level at $1332.40 will mean the buying is getting stronger. This is a potential trigger point for a surge into $1346.40.
Taking out the bottom of the triangle at $1320.30 could trigger an acceleration into $1312.30, followed by an uptrending angle at $1307.30.
Summary, bullish over $1330.40 and bearish under $1320.30.
This article was originally posted on FX Empire
