
 Yahoo Finance
 How Do Goldpac Group Limited’s (HKG:3315) Returns Compare To Its Industry?

Today we’ll look at Goldpac Group Limited (HKG:3315) and reflect on its potential as an investment. To be precise, we’ll consider its Return On Capital Employed (ROCE), as that will inform our view of the quality of the business.
First, we’ll go over how we calculate ROCE. Second, we’ll look at its ROCE compared to similar companies. And finally, we’ll look at how its current liabilities are impacting its ROCE.
Understanding Return On Capital Employed (ROCE)
ROCE is a metric for evaluating how much pre-tax income (in percentage terms) a company earns on the capital invested in its business. All else being equal, a better business will have a higher ROCE. In brief, it is a useful tool, but it is not without drawbacks. Author Edwin Whiting says to be careful when comparing the ROCE of different businesses, since ‘No two businesses are exactly alike.’
How Do You Calculate Return On Capital Employed?
Analysts use this formula to calculate return on capital employed:
Return on Capital Employed = Earnings Before Interest and Tax (EBIT) ÷ (Total Assets – Current Liabilities)
Or for Goldpac Group:
0.073 = CN¥166m ÷ (CN¥2.6b – CN¥659m) (Based on the trailing twelve months to June 2018.)
Therefore, Goldpac Group has an ROCE of 7.3%.
See our latest analysis for Goldpac Group
Want to help shape the future of investing tools and platforms? Take the survey and be part of one of the most advanced studies of stock market investors to date.
Is Goldpac Group’s ROCE Good?
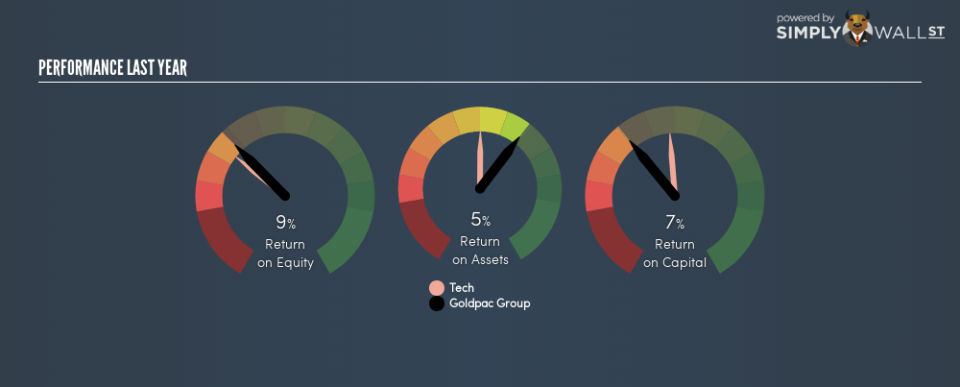
ROCE can be useful when making comparisons, such as between similar companies. Goldpac Group’s ROCE appears to be substantially greater than the 5.7% average in the Tech industry. We consider this a positive sign, because it suggests it uses capital more efficiently than similar companies. Separate from how Goldpac Group stacks up against its industry, its ROCE in absolute terms is mediocre; relative to the returns on government bonds. It is possible that there are more rewarding investments out there.
As we can see, Goldpac Group currently has an ROCE of 7.3%, less than the 11% it reported 3 years ago. So investors might consider if it has had issues recently.
When considering this metric, keep in mind that it is backwards looking, and not necessarily predictive. ROCE can be misleading for companies in cyclical industries, with returns looking impressive during the boom times, but very weak during the busts. ROCE is, after all, simply a snap shot of a single year. How cyclical is Goldpac Group? You can see for yourself by looking at this free graph of past earnings, revenue and cash flow.
Do Goldpac Group’s Current Liabilities Skew Its ROCE?
Short term (or current) liabilities, are things like supplier invoices, overdrafts, or tax bills that need to be paid within 12 months. Due to the way ROCE is calculated, a high level of current liabilities makes a company look as though it has less capital employed, and thus can (sometimes unfairly) boost the ROCE. To check the impact of this, we calculate if a company has high current liabilities relative to its total assets.
Goldpac Group has total assets of CN¥2.6b and current liabilities of CN¥659m. As a result, its current liabilities are equal to approximately 25% of its total assets. This very reasonable level of current liabilities would not boost the ROCE by much.
Our Take On Goldpac Group’s ROCE
That said, Goldpac Group’s ROCE is mediocre, there may be more attractive investments around. But note: Goldpac Group may not be the best stock to buy. So take a peek at this free list of interesting companies with strong recent earnings growth (and a P/E ratio below 20).
For those who like to find winning investments this free list of growing companies with recent insider purchasing, could be just the ticket.
To help readers see past the short term volatility of the financial market, we aim to bring you a long-term focused research analysis purely driven by fundamental data. Note that our analysis does not factor in the latest price-sensitive company announcements.
The author is an independent contributor and at the time of publication had no position in the stocks mentioned. For errors that warrant correction please contact the editor at editorial-team@simplywallst.com.
