
 Yahoo Finance
 How Good Is Ryman Healthcare Limited (NZSE:RYM) At Creating Shareholder Value?

Today we are going to look at Ryman Healthcare Limited (NZSE:RYM) to see whether it might be an attractive investment prospect. In particular, we'll consider its Return On Capital Employed (ROCE), as that can give us insight into how profitably the company is able to employ capital in its business.
First, we'll go over how we calculate ROCE. Next, we'll compare it to others in its industry. Then we'll determine how its current liabilities are affecting its ROCE.
What is Return On Capital Employed (ROCE)?
ROCE measures the amount of pre-tax profits a company can generate from the capital employed in its business. In general, businesses with a higher ROCE are usually better quality. In brief, it is a useful tool, but it is not without drawbacks. Author Edwin Whiting says to be careful when comparing the ROCE of different businesses, since 'No two businesses are exactly alike.'
So, How Do We Calculate ROCE?
Analysts use this formula to calculate return on capital employed:
Return on Capital Employed = Earnings Before Interest and Tax (EBIT) ÷ (Total Assets - Current Liabilities)
Or for Ryman Healthcare:
0.009 = NZ$55m ÷ (NZ$6.7b - NZ$551m) (Based on the trailing twelve months to March 2019.)
Therefore, Ryman Healthcare has an ROCE of 0.9%.
View our latest analysis for Ryman Healthcare
Does Ryman Healthcare Have A Good ROCE?
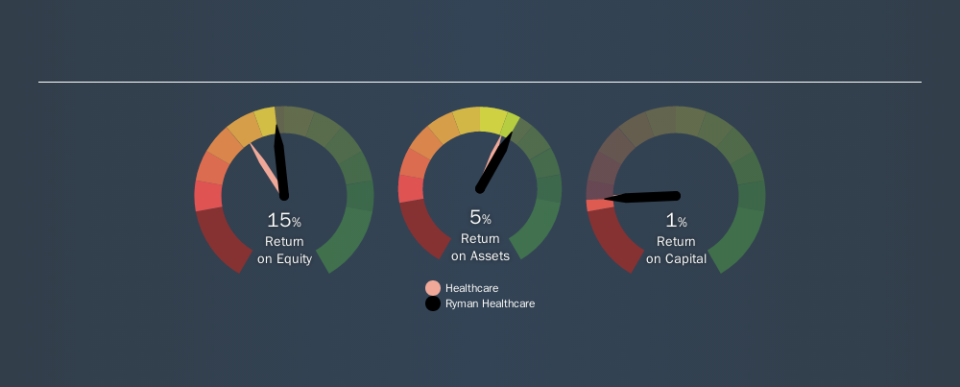
One way to assess ROCE is to compare similar companies. We can see Ryman Healthcare's ROCE is around the 0.9% average reported by the Healthcare industry. Independently of how Ryman Healthcare compares to its industry, its ROCE in absolute terms is low; especially compared to the ~2.4% available in government bonds. It is likely that there are more attractive prospects out there.
The image below shows how Ryman Healthcare's ROCE compares to its industry, and you can click it to see more detail on its past growth.
When considering this metric, keep in mind that it is backwards looking, and not necessarily predictive. Companies in cyclical industries can be difficult to understand using ROCE, as returns typically look high during boom times, and low during busts. This is because ROCE only looks at one year, instead of considering returns across a whole cycle. Future performance is what matters, and you can see analyst predictions in our free report on analyst forecasts for the company.
What Are Current Liabilities, And How Do They Affect Ryman Healthcare's ROCE?
Current liabilities are short term bills and invoices that need to be paid in 12 months or less. Due to the way ROCE is calculated, a high level of current liabilities makes a company look as though it has less capital employed, and thus can (sometimes unfairly) boost the ROCE. To check the impact of this, we calculate if a company has high current liabilities relative to its total assets.
Ryman Healthcare has total assets of NZ$6.7b and current liabilities of NZ$551m. Therefore its current liabilities are equivalent to approximately 8.3% of its total assets. Ryman Healthcare has a low level of current liabilities, which have a negligible impact on its already low ROCE.
The Bottom Line On Ryman Healthcare's ROCE
Still, investors could probably find more attractive prospects with better performance out there. But note: make sure you look for a great company, not just the first idea you come across. So take a peek at this free list of interesting companies with strong recent earnings growth (and a P/E ratio below 20).
For those who like to find winning investments this free list of growing companies with recent insider purchasing, could be just the ticket.
We aim to bring you long-term focused research analysis driven by fundamental data. Note that our analysis may not factor in the latest price-sensitive company announcements or qualitative material.
If you spot an error that warrants correction, please contact the editor at editorial-team@simplywallst.com. This article by Simply Wall St is general in nature. It does not constitute a recommendation to buy or sell any stock, and does not take account of your objectives, or your financial situation. Simply Wall St has no position in the stocks mentioned. Thank you for reading.
