
 Yahoo Finance
 If You Had Bought Metro Performance Glass (NZSE:MPG) Stock Three Years Ago, You'd Be Sitting On A 85% Loss, Today

Metro Performance Glass Limited (NZSE:MPG) shareholders should be happy to see the share price up 16% in the last month. But the last three years have seen a terrible decline. The share price has sunk like a leaky ship, down 85% in that time. Arguably, the recent bounce is to be expected after such a bad drop. But the more important question is whether the underlying business can justify a higher price still.
We really feel for shareholders in this scenario. It's a good reminder of the importance of diversification, and it's worth keeping in mind there's more to life than money, anyway.
View our latest analysis for Metro Performance Glass
There is no denying that markets are sometimes efficient, but prices do not always reflect underlying business performance. One flawed but reasonable way to assess how sentiment around a company has changed is to compare the earnings per share (EPS) with the share price.
During the three years that the share price fell, Metro Performance Glass's earnings per share (EPS) dropped by 37% each year. This change in EPS is reasonably close to the 46% average annual decrease in the share price. So it seems like sentiment towards the stock hasn't changed all that much over time. In this case, it seems that the EPS is guiding the share price.
The graphic below depicts how EPS has changed over time (unveil the exact values by clicking on the image).
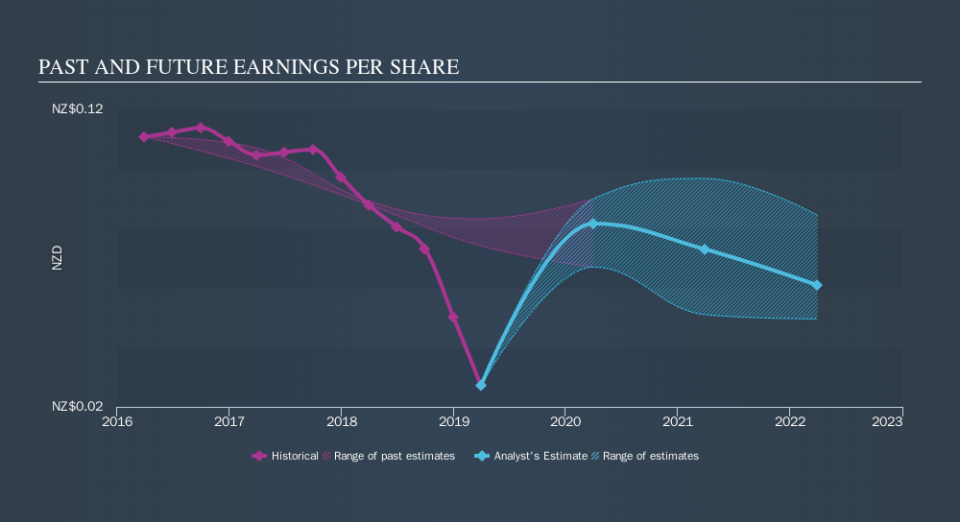
This free interactive report on Metro Performance Glass's earnings, revenue and cash flow is a great place to start, if you want to investigate the stock further.
A Dividend Lost
It's important to keep in mind that we've been talking about the share price returns, which don't include dividends, while the total shareholder return does. By accounting for the value of dividends paid, the TSR can be seen as a more complete measure of the value a company brings to its shareholders. Metro Performance Glass's TSR over the last 3 years is -82%; better than its share price return. Although the company had to cut dividends, it has paid cash to shareholders in the past.
A Different Perspective
Investors in Metro Performance Glass had a tough year, with a total loss of 60%, against a market gain of about 14%. However, keep in mind that even the best stocks will sometimes underperform the market over a twelve month period. Unfortunately, last year's performance may indicate unresolved challenges, given that it was worse than the annualised loss of 26% over the last half decade. We realise that Buffett has said investors should 'buy when there is blood on the streets', but we caution that investors should first be sure they are buying a high quality businesses. Is Metro Performance Glass cheap compared to other companies? These 3 valuation measures might help you decide.
If you like to buy stocks alongside management, then you might just love this free list of companies. (Hint: insiders have been buying them).
Please note, the market returns quoted in this article reflect the market weighted average returns of stocks that currently trade on NZ exchanges.
We aim to bring you long-term focused research analysis driven by fundamental data. Note that our analysis may not factor in the latest price-sensitive company announcements or qualitative material.
If you spot an error that warrants correction, please contact the editor at editorial-team@simplywallst.com. This article by Simply Wall St is general in nature. It does not constitute a recommendation to buy or sell any stock, and does not take account of your objectives, or your financial situation. Simply Wall St has no position in the stocks mentioned. Thank you for reading.
