
 Yahoo Finance
 Hercules Site Services (LON:HERC) Might Be Having Difficulty Using Its Capital Effectively
There are a few key trends to look for if we want to identify the next multi-bagger. In a perfect world, we'd like to see a company investing more capital into its business and ideally the returns earned from that capital are also increasing. If you see this, it typically means it's a company with a great business model and plenty of profitable reinvestment opportunities. In light of that, when we looked at Hercules Site Services (LON:HERC) and its ROCE trend, we weren't exactly thrilled.
Understanding Return On Capital Employed (ROCE)
For those who don't know, ROCE is a measure of a company's yearly pre-tax profit (its return), relative to the capital employed in the business. Analysts use this formula to calculate it for Hercules Site Services:
Return on Capital Employed = Earnings Before Interest and Tax (EBIT) ÷ (Total Assets - Current Liabilities)
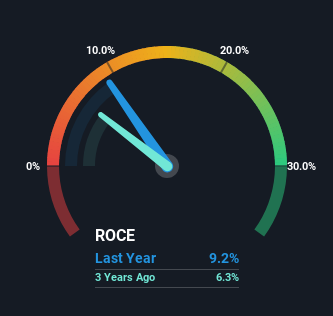
0.092 = UK£2.1m ÷ (UK£48m - UK£25m) (Based on the trailing twelve months to September 2023).
Thus, Hercules Site Services has an ROCE of 9.2%. Ultimately, that's a low return and it under-performs the Construction industry average of 12%.
See our latest analysis for Hercules Site Services
Above you can see how the current ROCE for Hercules Site Services compares to its prior returns on capital, but there's only so much you can tell from the past. If you'd like, you can check out the forecasts from the analysts covering Hercules Site Services for free.
The Trend Of ROCE
On the surface, the trend of ROCE at Hercules Site Services doesn't inspire confidence. Around five years ago the returns on capital were 54%, but since then they've fallen to 9.2%. However, given capital employed and revenue have both increased it appears that the business is currently pursuing growth, at the consequence of short term returns. And if the increased capital generates additional returns, the business, and thus shareholders, will benefit in the long run.
On a side note, Hercules Site Services' current liabilities are still rather high at 53% of total assets. This effectively means that suppliers (or short-term creditors) are funding a large portion of the business, so just be aware that this can introduce some elements of risk. Ideally we'd like to see this reduce as that would mean fewer obligations bearing risks.
The Bottom Line
In summary, despite lower returns in the short term, we're encouraged to see that Hercules Site Services is reinvesting for growth and has higher sales as a result. However, despite the promising trends, the stock has fallen 15% over the last year, so there might be an opportunity here for astute investors. As a result, we'd recommend researching this stock further to uncover what other fundamentals of the business can show us.
Hercules Site Services does come with some risks though, we found 3 warning signs in our investment analysis, and 1 of those makes us a bit uncomfortable...
For those who like to invest in solid companies, check out this free list of companies with solid balance sheets and high returns on equity.
Have feedback on this article? Concerned about the content? Get in touch with us directly. Alternatively, email editorial-team (at) simplywallst.com.
This article by Simply Wall St is general in nature. We provide commentary based on historical data and analyst forecasts only using an unbiased methodology and our articles are not intended to be financial advice. It does not constitute a recommendation to buy or sell any stock, and does not take account of your objectives, or your financial situation. We aim to bring you long-term focused analysis driven by fundamental data. Note that our analysis may not factor in the latest price-sensitive company announcements or qualitative material. Simply Wall St has no position in any stocks mentioned.
