
 Yahoo Finance
 Here's How P/E Ratios Can Help Us Understand Value Line, Inc. (NASDAQ:VALU)

This article is for investors who would like to improve their understanding of price to earnings ratios (P/E ratios). We'll show how you can use Value Line, Inc.'s (NASDAQ:VALU) P/E ratio to inform your assessment of the investment opportunity. What is Value Line's P/E ratio? Well, based on the last twelve months it is 23.86. In other words, at today's prices, investors are paying $23.86 for every $1 in prior year profit.
See our latest analysis for Value Line
How Do I Calculate A Price To Earnings Ratio?
The formula for price to earnings is:
Price to Earnings Ratio = Price per Share ÷ Earnings per Share (EPS)
Or for Value Line:
P/E of 23.86 = USD31.20 ÷ USD1.31 (Based on the year to October 2019.)
Is A High P/E Ratio Good?
The higher the P/E ratio, the higher the price tag of a business, relative to its trailing earnings. That isn't a good or a bad thing on its own, but a high P/E means that buyers have a higher opinion of the business's prospects, relative to stocks with a lower P/E.
Does Value Line Have A Relatively High Or Low P/E For Its Industry?
The P/E ratio indicates whether the market has higher or lower expectations of a company. The image below shows that Value Line has a lower P/E than the average (38.2) P/E for companies in the capital markets industry.
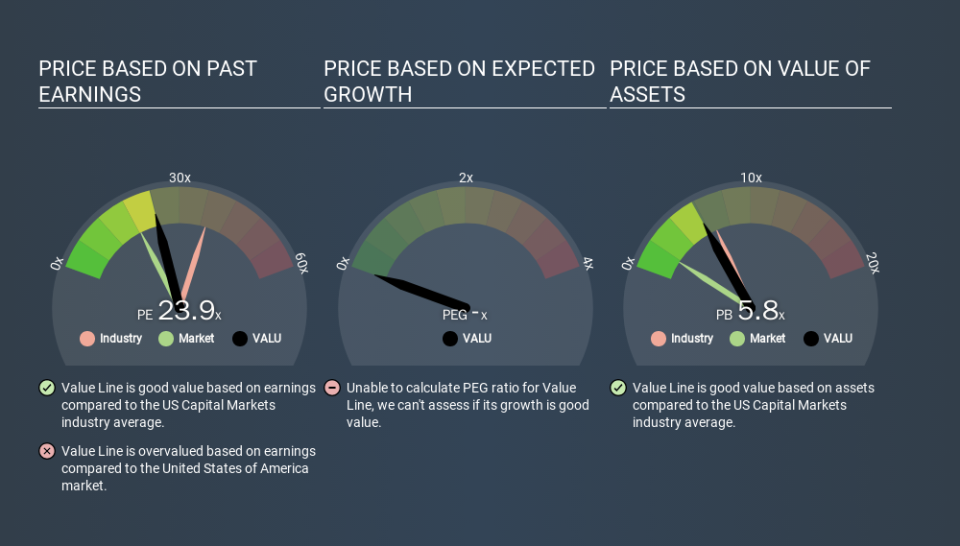
This suggests that market participants think Value Line will underperform other companies in its industry. Since the market seems unimpressed with Value Line, it's quite possible it could surprise on the upside. You should delve deeper. I like to check if company insiders have been buying or selling.
How Growth Rates Impact P/E Ratios
Earnings growth rates have a big influence on P/E ratios. That's because companies that grow earnings per share quickly will rapidly increase the 'E' in the equation. And in that case, the P/E ratio itself will drop rather quickly. Then, a lower P/E should attract more buyers, pushing the share price up.
Value Line saw earnings per share decrease by 25% last year. But EPS is up 11% over the last 5 years.
Remember: P/E Ratios Don't Consider The Balance Sheet
Don't forget that the P/E ratio considers market capitalization. So it won't reflect the advantage of cash, or disadvantage of debt. In theory, a company can lower its future P/E ratio by using cash or debt to invest in growth.
Such spending might be good or bad, overall, but the key point here is that you need to look at debt to understand the P/E ratio in context.
So What Does Value Line's Balance Sheet Tell Us?
Value Line has net cash of US$26m. That should lead to a higher P/E than if it did have debt, because its strong balance sheets gives it more options.
The Bottom Line On Value Line's P/E Ratio
Value Line trades on a P/E ratio of 23.9, which is above its market average of 18.4. Falling earnings per share is probably keeping traditional value investors away, but the healthy balance sheet means the company retains potential for future growth. If fails to eventuate, the current high P/E could prove to be temporary, as the share price falls.
Investors have an opportunity when market expectations about a stock are wrong. If the reality for a company is better than it expects, you can make money by buying and holding for the long term. Although we don't have analyst forecasts you could get a better understanding of its growth by checking out this more detailed historical graph of earnings, revenue and cash flow.
Of course you might be able to find a better stock than Value Line. So you may wish to see this free collection of other companies that have grown earnings strongly.
If you spot an error that warrants correction, please contact the editor at editorial-team@simplywallst.com. This article by Simply Wall St is general in nature. It does not constitute a recommendation to buy or sell any stock, and does not take account of your objectives, or your financial situation. Simply Wall St has no position in the stocks mentioned.
We aim to bring you long-term focused research analysis driven by fundamental data. Note that our analysis may not factor in the latest price-sensitive company announcements or qualitative material. Thank you for reading.
