
 Yahoo Finance
 Here's What's Concerning About Shriro Holdings' (ASX:SHM) Returns On Capital
To find a multi-bagger stock, what are the underlying trends we should look for in a business? Typically, we'll want to notice a trend of growing return on capital employed (ROCE) and alongside that, an expanding base of capital employed. If you see this, it typically means it's a company with a great business model and plenty of profitable reinvestment opportunities. Having said that, while the ROCE is currently high for Shriro Holdings (ASX:SHM), we aren't jumping out of our chairs because returns are decreasing.
Understanding Return On Capital Employed (ROCE)
Just to clarify if you're unsure, ROCE is a metric for evaluating how much pre-tax income (in percentage terms) a company earns on the capital invested in its business. To calculate this metric for Shriro Holdings, this is the formula:
Return on Capital Employed = Earnings Before Interest and Tax (EBIT) ÷ (Total Assets - Current Liabilities)
0.21 = AU$16m ÷ (AU$106m - AU$33m) (Based on the trailing twelve months to June 2022).
Therefore, Shriro Holdings has an ROCE of 21%. In absolute terms that's a great return and it's even better than the Consumer Durables industry average of 9.3%.
View our latest analysis for Shriro Holdings
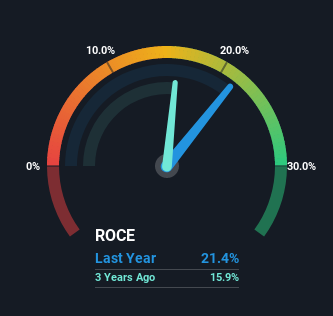
Historical performance is a great place to start when researching a stock so above you can see the gauge for Shriro Holdings' ROCE against it's prior returns. If you'd like to look at how Shriro Holdings has performed in the past in other metrics, you can view this free graph of past earnings, revenue and cash flow.
What The Trend Of ROCE Can Tell Us
On the surface, the trend of ROCE at Shriro Holdings doesn't inspire confidence. Historically returns on capital were even higher at 37%, but they have dropped over the last five years. Meanwhile, the business is utilizing more capital but this hasn't moved the needle much in terms of sales in the past 12 months, so this could reflect longer term investments. It may take some time before the company starts to see any change in earnings from these investments.
What We Can Learn From Shriro Holdings' ROCE
In summary, Shriro Holdings is reinvesting funds back into the business for growth but unfortunately it looks like sales haven't increased much just yet. And with the stock having returned a mere 1.9% in the last five years to shareholders, you could argue that they're aware of these lackluster trends. As a result, if you're hunting for a multi-bagger, we think you'd have more luck elsewhere.
If you want to continue researching Shriro Holdings, you might be interested to know about the 2 warning signs that our analysis has discovered.
Shriro Holdings is not the only stock earning high returns. If you'd like to see more, check out our free list of companies earning high returns on equity with solid fundamentals.
Have feedback on this article? Concerned about the content? Get in touch with us directly. Alternatively, email editorial-team (at) simplywallst.com.
This article by Simply Wall St is general in nature. We provide commentary based on historical data and analyst forecasts only using an unbiased methodology and our articles are not intended to be financial advice. It does not constitute a recommendation to buy or sell any stock, and does not take account of your objectives, or your financial situation. We aim to bring you long-term focused analysis driven by fundamental data. Note that our analysis may not factor in the latest price-sensitive company announcements or qualitative material. Simply Wall St has no position in any stocks mentioned.
Join A Paid User Research Session
You’ll receive a US$30 Amazon Gift card for 1 hour of your time while helping us build better investing tools for the individual investors like yourself. Sign up here
