
 Yahoo Finance
 Here's What's Concerning About Verizon Communications' (NYSE:VZ) Returns On Capital
If we want to find a potential multi-bagger, often there are underlying trends that can provide clues. Amongst other things, we'll want to see two things; firstly, a growing return on capital employed (ROCE) and secondly, an expansion in the company's amount of capital employed. Ultimately, this demonstrates that it's a business that is reinvesting profits at increasing rates of return. However, after investigating Verizon Communications (NYSE:VZ), we don't think it's current trends fit the mold of a multi-bagger.
Understanding Return On Capital Employed (ROCE)
For those that aren't sure what ROCE is, it measures the amount of pre-tax profits a company can generate from the capital employed in its business. To calculate this metric for Verizon Communications, this is the formula:
Return on Capital Employed = Earnings Before Interest and Tax (EBIT) ÷ (Total Assets - Current Liabilities)
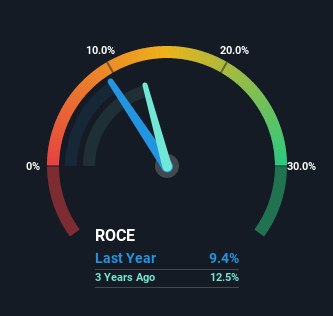
0.094 = US$31b ÷ (US$378b - US$48b) (Based on the trailing twelve months to March 2023).
Thus, Verizon Communications has an ROCE of 9.4%. On its own that's a low return, but compared to the average of 6.8% generated by the Telecom industry, it's much better.
Check out our latest analysis for Verizon Communications
Above you can see how the current ROCE for Verizon Communications compares to its prior returns on capital, but there's only so much you can tell from the past. If you'd like, you can check out the forecasts from the analysts covering Verizon Communications here for free.
What The Trend Of ROCE Can Tell Us
In terms of Verizon Communications' historical ROCE movements, the trend isn't fantastic. Around five years ago the returns on capital were 13%, but since then they've fallen to 9.4%. However it looks like Verizon Communications might be reinvesting for long term growth because while capital employed has increased, the company's sales haven't changed much in the last 12 months. It's worth keeping an eye on the company's earnings from here on to see if these investments do end up contributing to the bottom line.
The Bottom Line
Bringing it all together, while we're somewhat encouraged by Verizon Communications' reinvestment in its own business, we're aware that returns are shrinking. Unsurprisingly then, the total return to shareholders over the last five years has been flat. On the whole, we aren't too inspired by the underlying trends and we think there may be better chances of finding a multi-bagger elsewhere.
On a final note, we've found 1 warning sign for Verizon Communications that we think you should be aware of.
For those who like to invest in solid companies, check out this free list of companies with solid balance sheets and high returns on equity.
Have feedback on this article? Concerned about the content? Get in touch with us directly. Alternatively, email editorial-team (at) simplywallst.com.
This article by Simply Wall St is general in nature. We provide commentary based on historical data and analyst forecasts only using an unbiased methodology and our articles are not intended to be financial advice. It does not constitute a recommendation to buy or sell any stock, and does not take account of your objectives, or your financial situation. We aim to bring you long-term focused analysis driven by fundamental data. Note that our analysis may not factor in the latest price-sensitive company announcements or qualitative material. Simply Wall St has no position in any stocks mentioned.
Join A Paid User Research Session
You’ll receive a US$30 Amazon Gift card for 1 hour of your time while helping us build better investing tools for the individual investors like yourself. Sign up here
