Hibbett (HIBB) Q1 Earnings & Sales Miss Estimates on Inflation
Hibbett, Inc. HIBB posted drab first-quarter fiscal 2024 results, wherein earnings and sales missed the Zacks Consensus Estimate. Results were hurt by inflation, job losses, higher interest rates and weak consumer confidence that affected purchasing behavior, particularly for discretionary products and services. On the flip side, its store growth plan and improved product assortment to meet consumer’s demand remained tailwinds. Consequently, management lowered its fiscal 2024 view.
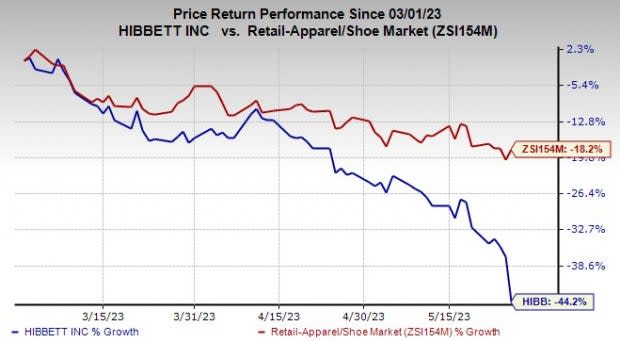
Shares of this Zacks Rank #4 (Sell) company have plunged 44.2% in the past three months compared with the industry's 18.2% decline.
Quarterly Highlights
Hibbett's adjusted earnings of $2.74 per share fell 5.2% from the $2.89 reported in the prior-year quarter. However, the figure lagged the Zacks Consensus Estimate of $2.98.

Image Source: Zacks Investment Research
Net sales advanced 7.4% year over year to $455.5 million for the quarter under review. However, the figure missed the Zacks Consensus Estimate of $458 million.
Comparable store sales (comps) grew 4.1% and came below our estimate of 8.3%. Meanwhile, in-store comps rose 4.7% for the quarter under review. E-commerce sales rose 0.6% year over year and accounted for 13.7% of the total sales.
The gross profit decreased 2% year over year to $153.6 million for the reported quarter. Meanwhile, the gross margin contracted 330 basis points (bps) to 33.7%, driven by lower average product margin stemming from higher promotional activity across both footwear and apparel.
Operating income was $45.9 million, down 9.5% year over year, whereas the operating margin contracted 190 bps to 10.1% for the reported quarter.
Store operating, selling and administrative (SG&A) expenses, as a percentage of sales, contracted nearly 140 bps to 21.1%, driven by expense reduction initiatives, lower advertising spend and lower incentive compensation expense, somewhat offset by wage inflation.
Other Financials
As of Apr 29, Hibbett had $26.9 million in cash and cash equivalents, and total stockholders' investment of $399 million. In the fiscal first quarter, Hibbett repurchased 159,592 shares worth $10.2 million. Management paid out a quarterly dividend of 25 cents.
Store Update
In first-quarter fiscal 2024, the company opened ten stores. As of Apr 29, 2023, it had 1,143 stores across 36 states.
Hibbett, Inc. Price, Consensus and EPS Surprise
Hibbett, Inc. price-consensus-eps-surprise-chart | Hibbett, Inc. Quote
Looking Ahead
Management anticipates inflation and weak consumer demand to continue in fiscal 2024 and also expects these headwinds to be more impactful in the fiscal second quarter. As a result, it lowered its fiscal 2024 view.
Hibbett now expects net sales to remain flat to decline 2% compared to the prior guidance of mid-single-digit growth for fiscal 2024, including the impacts of the 53rd week. The company still anticipates 26% sales growth in the fiscal first quarter, 22% in the fiscal second quarter, 24% in the fiscal third quarter and 28% in the fiscal fourth quarter.
Hibbett anticipates comparable sales decline of down low-single digit compared with the earlier guided range of low-single digit growth and in-store comps to decline low-single digits, which compares unfavorably with the previous guidance of flat to low-single digit growth. Meanwhile, e-commerce is anticipated to decline in the low-single digit range, down from the prior view of a high-single-digit growth.
The gross margin is envisioned to be 33.9-34%, down from the previously communicated view of 34.9-35% due to higher promotions and inflation on occupancy costs. The operating margin is predicted to be 7.4-7.8%, down from prior guidance of 9-9.3% due to lower margins and cost deleverage.
SG&A, as a percent of net sales, is estimated to be 23.3-23.5%, up from the last outlook of 23.2-23.3%. Also, interest expenses, as a percentage of net sales, are projected to be 0.4-0.45%, up from 0.25-0.3%.
Earnings are anticipated to be $7-$7.75, down from the earlier guided view of $9.50-$10.00 per share. Also, the effective tax rate is expected to be 23.5-23.7% compared to the previously communicated view of 24%. For fiscal 2024, capital expenditure is still expected to be $60-$70 million for investment in new stores, remodels, technology advancement and infrastructure.
Stocks to Consider
Some better-ranked stocks that investors may consider are Tecnoglass TGLS, Kroger KR and TJX Companies TJX.
Tecnoglass manufactures and sells architectural glass and aluminum products for the residential and commercial construction industries. TGLS currently sports a Zacks Rank #1 (Strong Buy). You can see the complete list of today’s Zacks #1 Rank stocks here.
The Zacks Consensus Estimate for Tecnoglass’ current financial-year sales and earnings per share suggests growth of 18.1% and 23.8%, respectively, from the year-ago reported figures. TGLS has a trailing four-quarter earnings surprise of 22.7%, on average.
Kroger, a renowned grocery retailer, currently carries a Zacks Rank of 2 (Buy). KR has a trailing four-quarter earnings surprise of 9.8%, on average.
The Zacks Consensus Estimate for Kroger’s current financial year’s earnings per share suggests growth of 6.6% from the year-ago reported figure. KR has an expected earnings per share growth rate of 6% for three to five years.
TJX Companies, which operates as an off-price apparel and home fashion retailer, carries a Zacks Rank #2. The expected EPS growth rate for three to five years is 10.5%.
The Zacks Consensus Estimate for TJX Companies’ current financial-year sales and earnings suggests growth of 6.4% and 14.5%, respectively, from the year-ago period. TJX has a trailing four-quarter earnings surprise of 4.4%, on average.
Want the latest recommendations from Zacks Investment Research? Today, you can download 7 Best Stocks for the Next 30 Days. Click to get this free report
The TJX Companies, Inc. (TJX) : Free Stock Analysis Report
The Kroger Co. (KR) : Free Stock Analysis Report
Hibbett, Inc. (HIBB) : Free Stock Analysis Report
Tecnoglass Inc. (TGLS) : Free Stock Analysis Report

 Yahoo Finance