
 Yahoo Finance
 Hibiscus Petroleum Berhad's (KLSE:HIBISCS) Prospects Need A Boost To Lift Shares
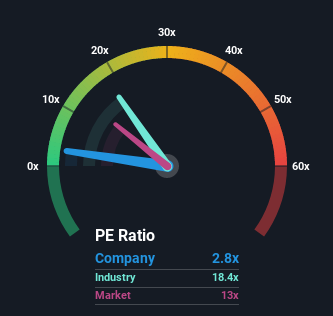
With a price-to-earnings (or "P/E") ratio of 2.8x Hibiscus Petroleum Berhad (KLSE:HIBISCS) may be sending very bullish signals at the moment, given that almost half of all companies in Malaysia have P/E ratios greater than 13x and even P/E's higher than 24x are not unusual. However, the P/E might be quite low for a reason and it requires further investigation to determine if it's justified.
With earnings growth that's superior to most other companies of late, Hibiscus Petroleum Berhad has been doing relatively well. One possibility is that the P/E is low because investors think this strong earnings performance might be less impressive moving forward. If not, then existing shareholders have reason to be quite optimistic about the future direction of the share price.
Check out our latest analysis for Hibiscus Petroleum Berhad
Want the full picture on analyst estimates for the company? Then our free report on Hibiscus Petroleum Berhad will help you uncover what's on the horizon.
Is There Any Growth For Hibiscus Petroleum Berhad?
The only time you'd be truly comfortable seeing a P/E as depressed as Hibiscus Petroleum Berhad's is when the company's growth is on track to lag the market decidedly.
Retrospectively, the last year delivered an exceptional 411% gain to the company's bottom line. The latest three year period has also seen an excellent 303% overall rise in EPS, aided by its short-term performance. Therefore, it's fair to say the earnings growth recently has been superb for the company.
Shifting to the future, estimates from the seven analysts covering the company suggest earnings growth is heading into negative territory, declining 18% each year over the next three years. That's not great when the rest of the market is expected to grow by 12% each year.
In light of this, it's understandable that Hibiscus Petroleum Berhad's P/E would sit below the majority of other companies. However, shrinking earnings are unlikely to lead to a stable P/E over the longer term. Even just maintaining these prices could be difficult to achieve as the weak outlook is weighing down the shares.
The Key Takeaway
We'd say the price-to-earnings ratio's power isn't primarily as a valuation instrument but rather to gauge current investor sentiment and future expectations.
We've established that Hibiscus Petroleum Berhad maintains its low P/E on the weakness of its forecast for sliding earnings, as expected. Right now shareholders are accepting the low P/E as they concede future earnings probably won't provide any pleasant surprises. Unless these conditions improve, they will continue to form a barrier for the share price around these levels.
There are also other vital risk factors to consider and we've discovered 2 warning signs for Hibiscus Petroleum Berhad (1 doesn't sit too well with us!) that you should be aware of before investing here.
Of course, you might find a fantastic investment by looking at a few good candidates. So take a peek at this free list of companies with a strong growth track record, trading on a P/E below 20x.
Have feedback on this article? Concerned about the content? Get in touch with us directly. Alternatively, email editorial-team (at) simplywallst.com.
This article by Simply Wall St is general in nature. We provide commentary based on historical data and analyst forecasts only using an unbiased methodology and our articles are not intended to be financial advice. It does not constitute a recommendation to buy or sell any stock, and does not take account of your objectives, or your financial situation. We aim to bring you long-term focused analysis driven by fundamental data. Note that our analysis may not factor in the latest price-sensitive company announcements or qualitative material. Simply Wall St has no position in any stocks mentioned.
Join A Paid User Research Session
You’ll receive a US$30 Amazon Gift card for 1 hour of your time while helping us build better investing tools for the individual investors like yourself. Sign up here
