
 Yahoo Finance
 INDUS Holding (ETR:INH) Will Be Looking To Turn Around Its Returns
When we're researching a company, it's sometimes hard to find the warning signs, but there are some financial metrics that can help spot trouble early. Businesses in decline often have two underlying trends, firstly, a declining return on capital employed (ROCE) and a declining base of capital employed. This reveals that the company isn't compounding shareholder wealth because returns are falling and its net asset base is shrinking. And from a first read, things don't look too good at INDUS Holding (ETR:INH), so let's see why.
Return On Capital Employed (ROCE): What Is It?
For those that aren't sure what ROCE is, it measures the amount of pre-tax profits a company can generate from the capital employed in its business. To calculate this metric for INDUS Holding, this is the formula:
Return on Capital Employed = Earnings Before Interest and Tax (EBIT) ÷ (Total Assets - Current Liabilities)
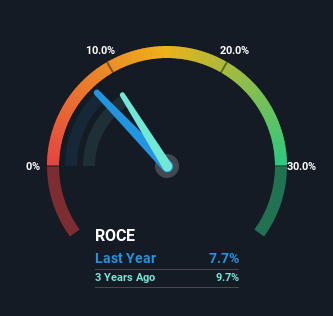
0.077 = €115m ÷ (€2.0b - €539m) (Based on the trailing twelve months to September 2022).
So, INDUS Holding has an ROCE of 7.7%. In absolute terms, that's a low return but it's around the Industrials industry average of 8.6%.
Check out our latest analysis for INDUS Holding
In the above chart we have measured INDUS Holding's prior ROCE against its prior performance, but the future is arguably more important. If you'd like, you can check out the forecasts from the analysts covering INDUS Holding here for free.
What Can We Tell From INDUS Holding's ROCE Trend?
We are a bit worried about the trend of returns on capital at INDUS Holding. Unfortunately the returns on capital have diminished from the 12% that they were earning five years ago. On top of that, it's worth noting that the amount of capital employed within the business has remained relatively steady. This combination can be indicative of a mature business that still has areas to deploy capital, but the returns received aren't as high due potentially to new competition or smaller margins. So because these trends aren't typically conducive to creating a multi-bagger, we wouldn't hold our breath on INDUS Holding becoming one if things continue as they have.
Our Take On INDUS Holding's ROCE
In summary, it's unfortunate that INDUS Holding is generating lower returns from the same amount of capital. Long term shareholders who've owned the stock over the last five years have experienced a 57% depreciation in their investment, so it appears the market might not like these trends either. With underlying trends that aren't great in these areas, we'd consider looking elsewhere.
One more thing to note, we've identified 2 warning signs with INDUS Holding and understanding them should be part of your investment process.
While INDUS Holding isn't earning the highest return, check out this free list of companies that are earning high returns on equity with solid balance sheets.
Have feedback on this article? Concerned about the content? Get in touch with us directly. Alternatively, email editorial-team (at) simplywallst.com.
This article by Simply Wall St is general in nature. We provide commentary based on historical data and analyst forecasts only using an unbiased methodology and our articles are not intended to be financial advice. It does not constitute a recommendation to buy or sell any stock, and does not take account of your objectives, or your financial situation. We aim to bring you long-term focused analysis driven by fundamental data. Note that our analysis may not factor in the latest price-sensitive company announcements or qualitative material. Simply Wall St has no position in any stocks mentioned.
Join A Paid User Research Session
You’ll receive a US$30 Amazon Gift card for 1 hour of your time while helping us build better investing tools for the individual investors like yourself. Sign up here
