
 Yahoo Finance
 Intrinsic Calculation For Regions Financial Corporation (NYSE:RF) Shows Investors Are Overpaying

Pricing bank stocks such as RF is particularly challenging. Given that these companies adhere to a different set of rules relative to other companies, their cash flows should also be valued differently. Banks, for example, must hold certain levels of tiered capital in order to maintain a safe cash cushion. Looking at factors such as book values, in addition to the return and cost of equity, may be fitting for calculating RF’s true value. Below I will take you through how to value RF in a relatively effective and straightforward method.
See our latest analysis for Regions Financial
What Model Should You Use?
Financial firms differ to other sector firms primarily because of the kind of regulation they face and their asset composition. United States’s financial regulatory environment is relatively strict. Furthermore, banks generally don’t have substantial amounts of physical assets on their balance sheet. So the Excess Returns model is suitable for determining the intrinsic value of RF rather than the traditional discounted cash flow model, which places emphasis on factors such as depreciation and capex.
Deriving RF’s True Value
The main belief for Excess Returns is that equity value is how much the firm can earn, over and above its cost of equity, given the level of equity it has in the company at the moment. The returns above the cost of equity is known as excess returns:
Excess Return Per Share = (Stable Return On Equity – Cost Of Equity) (Book Value Of Equity Per Share)
= (0.12% – 11%) x $13.92 = $0.13
We use this value to calculate the terminal value of the company, which is how much we expect the company to continue to earn every year, forever. This is a common component of discounted cash flow models:
Terminal Value Per Share = Excess Return Per Share / (Cost of Equity – Expected Growth Rate)
= $0.13 / (11% – 2.9%) = $1.58
Putting this all together, we get the value of RF’s share:
Value Per Share = Book Value of Equity Per Share + Terminal Value Per Share
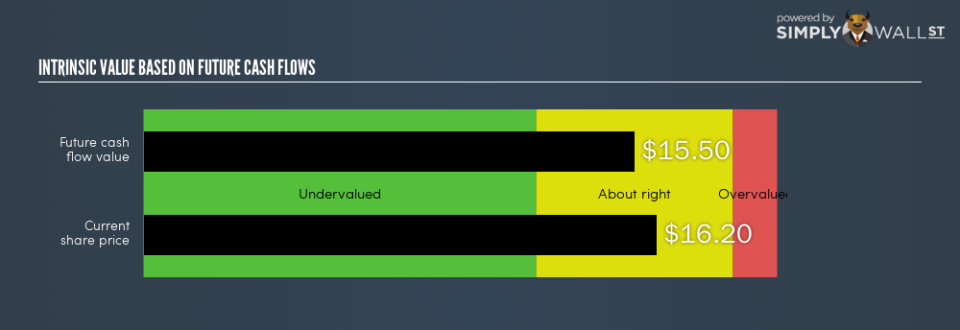
= $13.92 + $1.58 = $15.5
This results in an intrinsic value of $15.5. Compared to the current share price of US$16.20, RF is , at this time, priced in-line with its intrinsic value. This means there’s no real upside in buying RF at its current price. Pricing is one part of the analysis of your potential investment in RF. There are other important factors to keep in mind when assessing whether RF is the right investment in your portfolio.
Next Steps:
For banks, there are three key aspects you should look at:
Financial health: Does it have a healthy balance sheet? Take a look at our free bank analysis with six simple checks on things like bad loans and customer deposits.
Future earnings: What does the market think of RF going forward? Our analyst growth expectation chart helps visualize RF’s growth potential over the upcoming years.
Dividends: Most people buy financial stocks for their healthy and stable dividends. Check out whether RF is a dividend Rockstar with our historical and future dividend analysis.
For more details and sources, take a look at our full calculation on RF here.
To help readers see past the short term volatility of the financial market, we aim to bring you a long-term focused research analysis purely driven by fundamental data. Note that our analysis does not factor in the latest price-sensitive company announcements.
The author is an independent contributor and at the time of publication had no position in the stocks mentioned. For errors that warrant correction please contact the editor at editorial-team@simplywallst.com.
